SCOM Long Term Performance Model
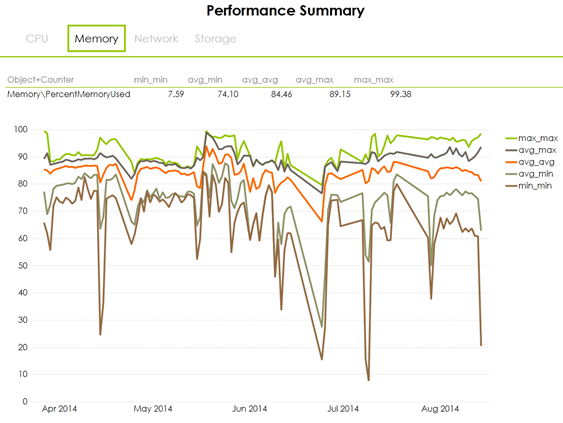
One can convert a seven day performance model to a 26 week model without a lot of trouble. I chose 182 days, because it won't impact the Power View reports I created very much. I will change the Perf query to use daily aggregated data instead of hourly aggregated data. As of this writing, the line charts in Power View support 1,000 data points. A line for one week of hourly data equates to 168 data points. A line for 26 weeks of daily data equates to 182 data points. For the chart of statistics with five lines both time periods stay below 1,000 data points.
The seven day model is the one I built then modified in my previous two posts:
blogs.technet.com/b/drewfs/archive/2014/08/12/scom-performance-data-and-power-view.aspx
blogs.technet.com/b/drewfs/archive/2014/08/14/scom-performance-model-with-configuration-data.aspx
I find long term data provides insights into trends and patterns which may not plainly appear within a week. One might identify behavior tied to a fiscal calendar or seasonal events. Also, the visualizations in Power View may help build a case for capacity changes. Overall, the reports help with data-driven analysis.
I should note that configuration changes become more apparent over time, too. That's why I used to store snapshots of server configuration in an operational database. Sudden changes in performance provoke questions about what happened and why.
Overview
A. Modify SQL Queries in the Performance Data Model
B. Refresh the Data and Review Reports
Step by step
A. Modify SQL Queries in the Performance Data Model
Open Perf 7d Model in Excel
Save the workbook as Perf 182d Model
Select Manage from the Data Model section of the POWERPIVOT menu
Select the Perf dataset tab
Select Table Properties from the ribbon in the Design menu
Enter a new query (Perf.vPerfHourly à Perf.vPerfDaily; 7 à 182)
/*Perf*/
SELECT PERF.ManagedEntityRowId
, PERF.PerformanceRuleInstanceRowId
, PERF.DateTime
, PERF.AverageValue
, PERF.MinValue
, PERF.MaxValue
, PERF.SampleCount
FROM Perf.vPerfDaily PERF
INNERJOIN vPerformanceRuleInstance PRI ON PRI.PerformanceRuleInstanceRowId = PERF.PerformanceRuleInstanceRowId
INNERJOIN vPerformanceRule PR ON PR.RuleRowId = PRI.RuleRowId
WHERE PERF.DateTime>(GETUTCDATE()- 182)
ORDERBY PERF.DateTime
Click Save
Select the Entity dataset tab
Select Table Properties from the ribbon in the Design menu
Enter a new query (7 à 182)
/*Entity*/
select distinct
ME.ManagedEntityRowId
, MET.ManagedEntityTypeDefaultName as METype
, TLMET.ManagedEntityTypeDefaultName as TLMEType
, ME.TopLevelHostManagedEntityRowId
, ME.ManagementGroupRowId
, ME.Name
, ME.DisplayName
, ME.Path
, ME.ManagedEntityTypeRowId
from Perf.vPerfDaily PERF
inner join vManagedEntity ME on ME.ManagedEntityRowId = PERF.ManagedEntityRowId
inner join vManagedEntityType MET on MET.ManagedEntityTypeRowId = ME.ManagedEntityTypeRowId
inner join vManagedEntity TLME on TLME.ManagedEntityRowId = ME.TopLevelHostManagedEntityRowId
inner join vManagedEntityType TLMET on TLMET.ManagedEntityTypeRowId = TLME.ManagedEntityTypeRowId
where PERF.DateTime >(GETUTCDATE() - 182)
order by ME.ManagedEntityTypeRowId
Click Save
B. Refresh the Data and Review Reports
Select Refresh All from the Refresh pulldown in the ribbon in the Home menu
Click Close when the refresh is complete
Close the Power Pivot window
Click OK in the Power View dialog window
Select Austin from the Themes pulldown in the Themes section of the ribbon of the POWER VIEW menu to distinguish the reports from the seven day model
Review the reports to make sure they are still presentable
Save the workbook
Comments
- Anonymous
August 27, 2014
If one built a short-term performance model for SCOM and converted it to long-term , then one might want


