Hinzufügen von Unterstützung für Drilldowns
Wenn ein Visual eine Hierarchie aufweist, können Sie Benutzern die Verwendung des Power BI-Drilldownfeatures ermöglichen, damit sie weitere Details anzeigen können.
Weitere Informationen zum Power BI-Drilldownfeature finden Sie in Drill-Modus in dem Power BI-Dienst. Informationen dazu, wie das Visual das Drillfeature dynamisch aktivieren oder deaktivieren kann, finden Sie unter Dynamisches Steuerelement für den Drilldown.
Aktivieren der Drilldownunterstützung im Visual
Um Drilldownaktionen im Visual zu unterstützen, fügen Sie capabilities.json ein neues Feld namens drill-down hinzu. Dieses Feld hat eine roles-Eigenschaft, die den Namen der dataRole enthält, für die Drilldownaktionen aktiviert werden sollen.
    "drilldown": {
        "roles": [
            "category"
        ]
    }
Hinweis
Der Drilldown „dataRole“ muss vom Typ Grouping sein.
Die max-Eigenschaft in den dataRole-Bedingungen muss auf 1 gesetzt sein.
Nachdem Sie dem Drilldownfeld die Rolle hinzugefügt haben, können Benutzer mehrere Felder in die Datenrolle ziehen.
Beispiel:
{
    "dataRoles": [
        {
            "displayName": "Category",
            "name": "category",
            "kind": "Grouping"
        },
        {
            "displayName": "Value",
            "name": "value",
            "kind": "Measure"
        }
    ],
    "drilldown": {
        "roles": [
            "category"
        ]
    },
    "dataViewMappings": [
        {
            "categorical": {
                "categories": {
                    "for": {
                        "in": "category"
                    }
                },
                "values": {
                    "select": [
                        {
                            "bind": {
                                "to": "value"
                            }
                        }
                    ]
                }
            }
        }
    ]
}
Erstellen eines Visuals mit Drilldown-Unterstützung
Führen Sie den folgenden Befehl aus, um ein visuelles Element mit Drilldown-Unterstützung zu erstellen:
pbiviz new testDrillDown -t default
Wenden Sie dann das obige Beispiel von capabilities.json auf das neu erstellte Visual an, um ein neues Standard-Beispielvisual zu erstellen.
Erstellen Sie die Eigenschaft für div-Container, um HTML-Elemente des Visuals zu speichern:
"use strict";

import "core-js/stable";
import "./../style/visual.less";
// imports

export class Visual implements IVisual {
    // visual properties
    // ...
    private div: HTMLDivElement; // <== NEW PROPERTY

    constructor(options: VisualConstructorOptions) {
        // constructor body
        // ...
    }

    public update(options: VisualUpdateOptions) {
        // update method body
        // ...
    }

    /**
     * Returns properties pane formatting model content hierarchies, properties and latest formatting values, Then populate properties pane.
     * This method is called once each time we open the properties pane or when the user edits any format property.
     */
    public getFormattingModel(): powerbi.visuals.FormattingModel {
        return this.formattingSettingsService.buildFormattingModel(this.formattingSettings);
    }
}
Aktualisieren Sie den Konstruktor des Visuals:
export class Visual implements IVisual {
    // visual properties
    // ...
    private div: HTMLDivElement;

    constructor(options: VisualConstructorOptions) {
        console.log('Visual constructor', options);
        this.formattingSettingsService = new FormattingSettingsService();
        this.target = options.element;
        this.updateCount = 0;

        if (document) {
            const new_p: HTMLElement = document.createElement("p");
            new_p.appendChild(document.createTextNode("Update count:"));
            const new_em: HTMLElement = document.createElement("em");
            this.textNode = document.createTextNode(this.updateCount.toString());
            new_em.appendChild(this.textNode);
            new_p.appendChild(new_em);
            this.div = document.createElement("div"); // <== CREATE DIV ELEMENT
            this.target.appendChild(new_p);
        }
    }
}
Um button zu erstellen, aktualisieren Sie mehrere update-Methode des visuellen Elements:
export class Visual implements IVisual {
    // ...

    public update(options: VisualUpdateOptions) {
        this.formattingSettings = this.formattingSettingsService.populateFormattingSettingsModel(VisualFormattingSettingsModel, options.dataViews);
        console.log('Visual update', options);

        const dataView: DataView = options.dataViews[0];
        const categoricalDataView: DataViewCategorical = dataView.categorical;

        // don't create elements if no data
        if (!options.dataViews[0].categorical ||
            !options.dataViews[0].categorical.categories) {
            return
        }

        // to display current level of hierarchy
        if (typeof this.textNode !== undefined) {
            this.textNode.textContent = categoricalDataView.categories[categoricalDataView.categories.length - 1].source.displayName.toString();
        }

        // remove old elements
        // for better performance use D3js pattern:
        // https://d3js.org/#enter-exit
        while (this.div.firstChild) {
            this.div.removeChild(this.div.firstChild);
        }

        // create buttons for each category value
        categoricalDataView.categories[categoricalDataView.categories.length - 1].values.forEach( (category: powerbi.PrimitiveValue, index: number) => {
            let button = document.createElement("button");
            button.innerText = category.toString();

            this.div.appendChild(button);
        })

    }
    // ...
Wenden Sie einfache Stile in .\style\visual.less an:
button {
    margin: 5px;
    min-width: 50px;
    min-height: 50px;
}
Bereiten Sie Beispieldaten zum Testen des Visuals vor:
| H1 | H2 | H3 | VALUES |
|---|---|---|---|
| A | A1 | A11 | 1 |
| A | A1 | A12 | 2 |
| A | A2 | A21 | 3 |
| A | A2 | A22 | 4 |
| A | A3 | A31 | 5 |
| A | A3 | A32 | 6 |
| B | B1 | B11 | 7 |
| B | B1 | B12 | 8 |
| B | B2 | B21 | 9 |
| B | B2 | B22 | 10 |
| B | B3 | B31 | 11 |
| B | B3 | B32 | 12 |
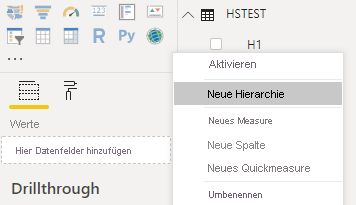
Und erstellen Sie eine Hierarchie in Power BI Desktop:
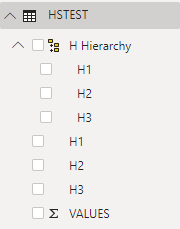
Schließen Sie alle Kategoriespalten (H1, H2, H3) in die neue Hierarchie ein:
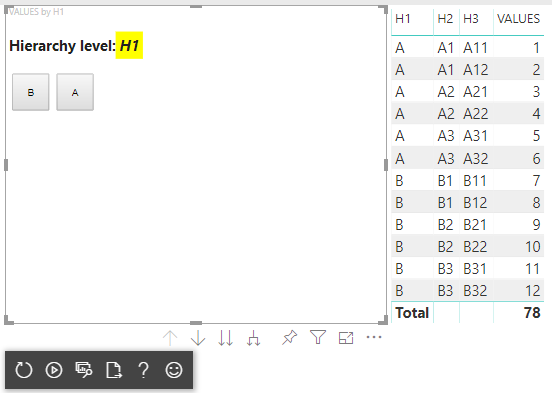
Nachdem Sie diese Schritte ausgeführt haben, sollten Sie Folgendes Visual erhalten:
Hinzufügen eines Kontextmenüs zu visuellen Elementen
Um ein Kontextmenü zu den Schaltflächen von dem visuellen Element hinzuzufügen:
Speichern Sie das host-Objekt in den Eigenschaften des Visuals. Rufen Sie dann die createSelectionManager-Methode zum Erstellen des Auswahl-Managers auf, um ein Kontextmenü mit der Power BI-Visuals-API anzuzeigen.
"use strict";

import "core-js/stable";
import "./../style/visual.less";
// default imports

import IVisualHost = powerbi.extensibility.visual.IVisualHost;
import ISelectionManager = powerbi.extensibility.ISelectionManager;
import ISelectionId = powerbi.visuals.ISelectionId;

export class Visual implements IVisual {
    // visual properties
    // ...
    private div: HTMLDivElement;
    private host: IVisualHost; // <== NEW PROPERTY
    private selectionManager: ISelectionManager; // <== NEW PROPERTY

    constructor(options: VisualConstructorOptions) {
        // constructor body
        // save the host in the visuals properties
        this.host = options.host;
        // create selection manager
        this.selectionManager = this.host.createSelectionManager();
        // ...
    }

    public update(options: VisualUpdateOptions) {
        // update method body
        // ...
    }

    // ...
}
Ändern Sie den Text des forEach-Funktionsrückrufs in:
    categoricalDataView.categories[categoricalDataView.categories.length - 1].values.forEach( (category: powerbi.PrimitiveValue, index: number) => {
        // create selectionID for each category value
        let selectionID: ISelectionId = this.host.createSelectionIdBuilder()
            .withCategory(categoricalDataView.categories[0], index)
            .createSelectionId();

        let button = document.createElement("button");
        button.innerText = category.toString();

        // add event listener to click event
        button.addEventListener("click", (event) => {
            // call select method in the selection manager
            this.selectionManager.select(selectionID);
        });

        button.addEventListener("contextmenu", (event) => {
            // call showContextMenu method to display context menu on the visual
            this.selectionManager.showContextMenu(selectionID, {
                x: event.clientX,
                y: event.clientY
            });
            event.preventDefault();
        });

        this.div.appendChild(button);
    });
Wenden Sie Daten auf das Visual an:
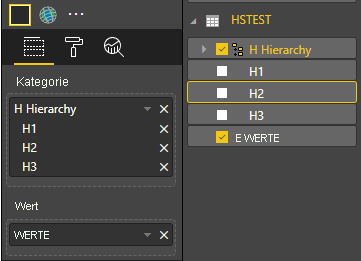
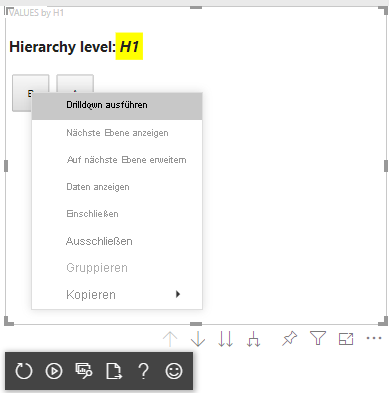
Im letzten Schritt sollte das Visual mit Auswahlmöglichkeiten und einem Kontextmenü angezeigt werden:

Hinzufügen von Drilldownunterstützung für die Zuordnung der Matrixdatenansicht
Um das Visual mit Zuordnungen der Matrixdatenansicht zu testen, bereiten Sie Beispieldaten vor:
| Row 1 | Zeile 2 | Zeile 3 | Spalte 1 | Spalte 2 | Spalte 3 | Werte |
|---|---|---|---|---|---|---|
| F1 | R11 | R111 | C1 | C11 | C111 | 1 |
| F1 | R11 | R112 | C1 | C11 | C112 | 2 |
| F1 | R11 | R113 | C1 | C11 | C113 | 3 |
| F1 | R12 | R121 | C1 | C12 | C121 | 4 |
| F1 | R12 | R122 | C1 | C12 | C122 | 5 |
| F1 | R12 | R123 | C1 | C12 | C123 | 6 |
| F1 | R13 | R131 | C1 | C13 | C131 | 7 |
| F1 | R13 | R132 | C1 | C13 | C132 | 8 |
| F1 | R13 | R133 | C1 | C13 | C133 | 9 |
| F2 | R21 | R211 | C2 | C21 | C211 | 10 |
| F2 | R21 | R212 | C2 | C21 | C212 | 11 |
| F2 | R21 | R213 | C2 | C21 | C213 | 12 |
| F2 | R22 | R221 | C2 | C22 | C221 | 13 |
| F2 | R22 | R222 | C2 | C22 | C222 | 14 |
| F2 | R22 | R223 | C2 | C22 | C223 | 16 |
| F2 | R23 | R231 | C2 | C23 | C231 | 17 |
| F2 | R23 | R232 | C2 | C23 | C232 | 18 |
| F2 | R23 | R233 | C2 | C23 | C233 | 19 |
Wenn Sie dann die folgende Zuordnung der Datenansicht auf das Visual an:
{
    "dataRoles": [
        {
            "displayName": "Columns",
            "name": "columns",
            "kind": "Grouping"
        },
        {
            "displayName": "Rows",
            "name": "rows",
            "kind": "Grouping"
        },
        {
            "displayName": "Value",
            "name": "value",
            "kind": "Measure"
        }
    ],
    "drilldown": {
        "roles": [
            "columns",
            "rows"
        ]
    },
    "dataViewMappings": [
        {
            "matrix": {
                "columns": {
                    "for": {
                        "in": "columns"
                    }
                },
                "rows": {
                    "for": {
                        "in": "rows"
                    }
                },
                "values": {
                    "for": {
                        "in": "value"
                    }
                }
            }
        }
    ]
}
Wenden Sie Daten auf das Visual an:
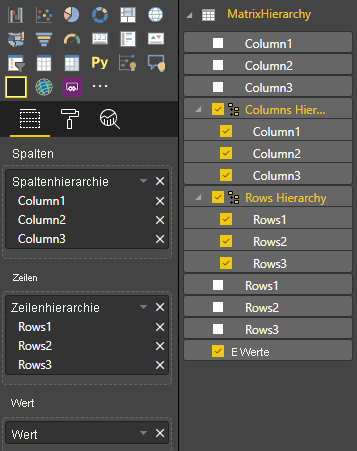
Importieren Sie die erforderlichen Schnittstellen, um Zuordnungen der Matrixdatenansicht zu verarbeiten:
// ...
import DataViewMatrix = powerbi.DataViewMatrix;
import DataViewMatrixNode = powerbi.DataViewMatrixNode;
import DataViewHierarchyLevel = powerbi.DataViewHierarchyLevel;
// ...
Erstellen Sie zwei Eigenschaften für zwei div-Zeilen- und -Spaltenelemente:
export class Visual implements IVisual {
    // ...
    private rowsDiv: HTMLDivElement;
    private colsDiv: HTMLDivElement;
    // ...
    constructor(options: VisualConstructorOptions) {
        // constructor body
        // ...
        // Create div elements and append to main div of the visual
        this.rowsDiv = document.createElement("div");
        this.target.appendChild(this.rowsDiv);

        this.colsDiv = document.createElement("div");
        this.target.appendChild(this.colsDiv);
    }
    // ...
}
Überprüfen Sie die Daten vor dem Rendern von Elementen, und zeigen Sie die aktuelle Hierarchieebene an:
export class Visual implements IVisual {
    // ...
    constructor(options: VisualConstructorOptions) {
        // constructor body
    }

    public update(options: VisualUpdateOptions) {
        this.formattingSettings = this.formattingSettingsService.populateFormattingSettingsModel(VisualFormattingSettingsModel, options.dataViews);
        console.log('Visual update', options);

        const dataView: DataView = options.dataViews[0];
        const matrixDataView: DataViewMatrix = dataView.matrix;

        // if the visual doesn't receive the data no reason to continue rendering
        if (!matrixDataView ||
            !matrixDataView.columns ||
            !matrixDataView.rows ) {
            return
        }

        // to display current level of hierarchy
        if (typeof this.textNode !== undefined) {
            this.textNode.textContent = categoricalDataView.categories[categoricalDataView.categories.length - 1].source.displayName.toString();
        }
        // ...
    }
    // ...
}
Erstellen Sie die Funktion treeWalker zum Durchlaufen der Hierarchie:
export class Visual implements IVisual {
    // ...
    public update(options: VisualUpdateOptions) {
        // ...

        // if the visual doesn't receive the data no reason to continue rendering
        if (!matrixDataView ||
            !matrixDataView.columns ||
            !matrixDataView.rows ) {
            return
        }

        const treeWalker = (matrixNode: DataViewMatrixNode, index: number, levels: DataViewHierarchyLevel[], div: HTMLDivElement)  => {
            // ...
            if (matrixNode.children) {
                // ...
                // traversing child nodes
                matrixNode.children.forEach((node, index) => treeWalker(node, index, levels, childDiv));
            }
        }

        // traversing rows
        const rowRoot: DataViewMatrixNode = matrixDataView.rows.root;
        rowRoot.children.forEach((node, index) => treeWalker(node, index, matrixDataView.rows.levels, this.rowsDiv));

        // traversing columns
        const colRoot = matrixDataView.columns.root;
        colRoot.children.forEach((node, index) => treeWalker(node, index, matrixDataView.columns.levels, this.colsDiv));
    }
    // ...
}
Generieren Sie die Auswahl für Datenpunkte.
const treeWalker = (matrixNode: DataViewMatrixNode, index: number, levels: DataViewHierarchyLevel[], div: HTMLDivElement)  => {
    // generate selectionID for each node of matrix
    const selectionID: ISelectionID = this.host.createSelectionIdBuilder()
        .withMatrixNode(matrixNode, levels)
        .createSelectionId();
    // ...
    if (matrixNode.children) {
        // ...
        // traversing child nodes
        matrixNode.children.forEach((node, index) => treeWalker(node, index, levels, childDiv));
    }
}
Erstellen Sie für jede Hierarchieebene ein div-Element:
const treeWalker = (matrixNode: DataViewMatrixNode, index: number, levels: DataViewHierarchyLevel[], div: HTMLDivElement)  => {
    // generate selectionID for each node of matrix
    const selectionID: ISelectionID = this.host.createSelectionIdBuilder()
        .withMatrixNode(matrixNode, levels)
        .createSelectionId();
    // ...
    if (matrixNode.children) {
        // create div element for level
        const childDiv = document.createElement("div");
        // add to current div
        div.appendChild(childDiv);
        // create paragraph element to display next
        const p = document.createElement("p");
        // display level name on paragraph element
        const level = levels[matrixNode.level];
        p.innerText = level.sources[level.sources.length - 1].displayName;
        // add paragraph element to created child div
        childDiv.appendChild(p);
        // traversing child nodes
        matrixNode.children.forEach((node, index) => treeWalker(node, index, levels, childDiv));
    }
}
Erstellen Sie buttons-Elemente, um mit dem Visual zu interagieren und ein Kontextmenü für Matrixdatenpunkte anzuzeigen:
const treeWalker = (matrixNode: DataViewMatrixNode, index: number, levels: DataViewHierarchyLevel[], div: HTMLDivElement)  => {
    // generate selectionID for each node of matrix
    const selectionID: ISelectionID = this.host.createSelectionIdBuilder()
        .withMatrixNode(matrixNode, levels)
        .createSelectionId();

    // create button element
    let button = document.createElement("button");
    // display node value/name of the button's text
    button.innerText = matrixNode.value.toString();

    // add event listener on click
    button.addEventListener("click", (event) => {
        // call select method in the selection manager
        this.selectionManager.select(selectionID);
    });

    // display context menu on click
    button.addEventListener("contextmenu", (event) => {
        // call showContextMenu method to display context menu on the visual
        this.selectionManager.showContextMenu(selectionID, {
            x: event.clientX,
            y: event.clientY
        });
        event.preventDefault();
    });

    div.appendChild(button);

    if (matrixNode.children) {
        // ...
    }
}
Löschen Sie div-Elemente, bevor Sie Elemente nochmals rendern:
public update(options: VisualUpdateOptions) {
    // ...
    const treeWalker = (matrixNode: DataViewMatrixNode, index: number, levels: DataViewHierarchyLevel[], div: HTMLDivElement)  => {
        // ...
    }

    // remove old elements
    // to better performance use D3js pattern:
    // https://d3js.org/#enter-exit
    while (this.rowsDiv.firstChild) {
        this.rowsDiv.removeChild(this.rowsDiv.firstChild);
    }
    // create label for row elements
    const prow = document.createElement("p");
    prow.innerText = "Rows";
    this.rowsDiv.appendChild(prow);

    while (this.colsDiv.firstChild) {
        this.colsDiv.removeChild(this.colsDiv.firstChild);
    }
    // create label for columns elements
    const pcol = document.createElement("p");
    pcol.innerText = "Columns";
    this.colsDiv.appendChild(pcol);

    // render elements for rows
    const rowRoot: DataViewMatrixNode = matrixDataView.rows.root;
    rowRoot.children.forEach((node, index) => treeWalker(node, index, matrixDataView.rows.levels, this.rowsDiv));

    // render elements for columns
    const colRoot = matrixDataView.columns.root;
    colRoot.children.forEach((node, index) => treeWalker(node, index, matrixDataView.columns.levels, this.colsDiv));
}
Schließlich sollte Ihnen ein Visual mit einem Kontextmenü angezeigt werden:
