Metrics for Application Gateway
Application Gateway publishes data points to Azure Monitor for the performance of your Application Gateway and backend instances. These data points are called metrics, and are numerical values in an ordered set of time-series data. Metrics describe some aspect of your application gateway at a particular time. If there are requests flowing through the Application Gateway, it measures and sends its metrics in 60-second intervals. If there are no requests flowing through the Application Gateway or no data for a metric, the metric isn't reported. For more information, see Azure Monitor metrics.
Metrics supported by Application Gateway V2 SKU
Note
For TLS/TCP proxy related information, visit data reference.
Timing metrics
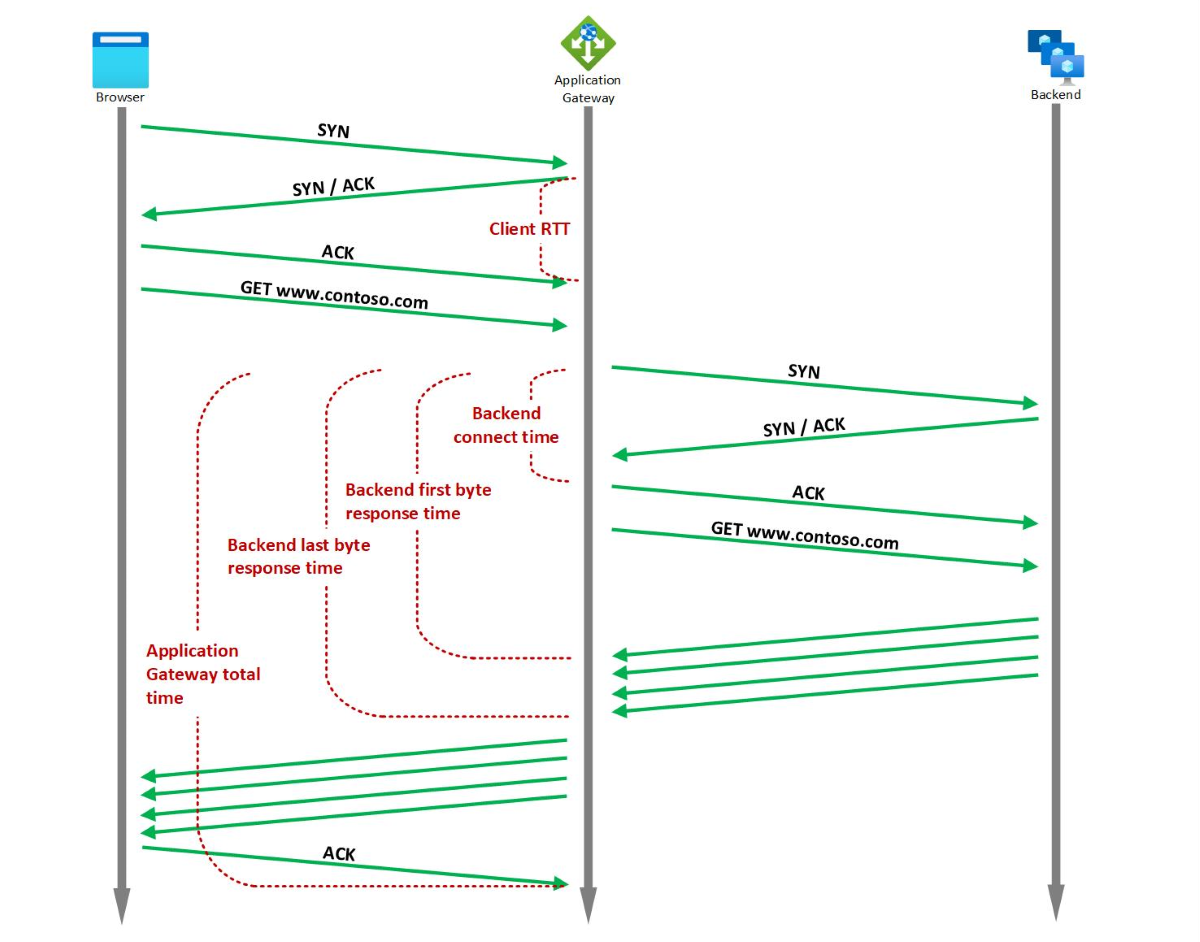
Application Gateway provides several built‑in timing metrics related to the request and response, which are all measured in milliseconds.
Note
If there is more than one listener in the Application Gateway, then always filter by Listener dimension while comparing different latency metrics in order to get meaningful inference.
You can use timing metrics to determine whether the observed slowdown is due to the client network, Application Gateway performance, the backend network and backend server TCP stack saturation, backend application performance, or large file size. For more information, see Timing metrics.
For example, if there's a spike in Backend first byte response time trend but the Backend connect time trend is stable, you can infer that the application gateway to backend latency and the time taken to establish the connection is stable. The spike is caused due to an increase in the response time of backend application. On the other hand, if the spike in Backend first byte response time is associated with a corresponding spike in Backend connect time, you can deduce that either the network between Application Gateway and backend server or the backend server TCP stack has saturated.
If you notice a spike in Backend last byte response time but the Backend first byte response time is stable, you can deduce that the spike is because of a larger file being requested.
Similarly, if the Application gateway total time has a spike but the Backend last byte response time is stable, then it can either be a sign of performance bottleneck at the Application Gateway or a bottleneck in the network between client and Application Gateway. Additionally, if the client RTT also has a corresponding spike, then it indicates that the degradation is because of the network between client and Application Gateway.
Application Gateway metrics
For Application Gateway, there are several metrics available. For a list, see Application Gateway metrics.
Backend metrics
For Application Gateway, There are several backend metrics available. For a list, see Backend metrics.
Web Application Firewall (WAF) metrics
For information on WAF Monitoring, see WAF v2 Metrics and WAF v1 Metrics.
Metrics visualization
Browse to an application gateway, under Monitoring select Metrics. To view the available values, select the METRIC drop-down list.
In the following image, you see an example with three metrics displayed for the last 30 minutes:

To see a current list of metrics, see Supported metrics with Azure Monitor.
Alert rules on metrics
You can start alert rules based on metrics for a resource. For example, an alert can call a webhook or email an administrator if the throughput of the application gateway is above, below, or at a threshold for a specified period.
The following example walks you through creating an alert rule that sends an email to an administrator after throughput breaches a threshold:
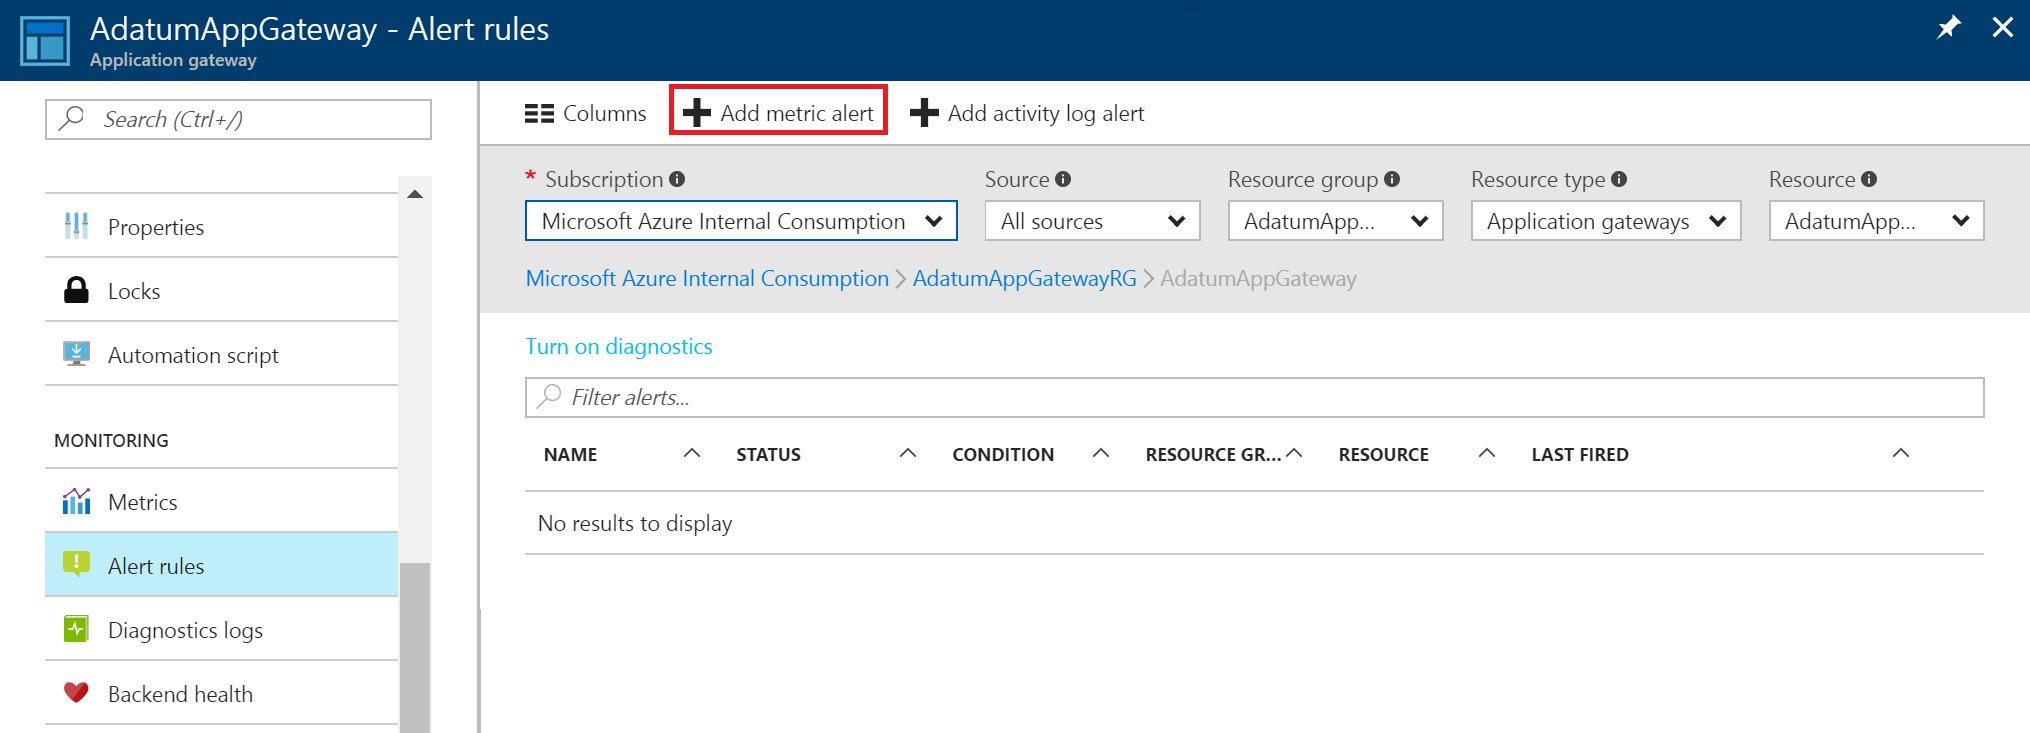
select Add metric alert to open the Add rule page. You can also reach this page from the metrics page.
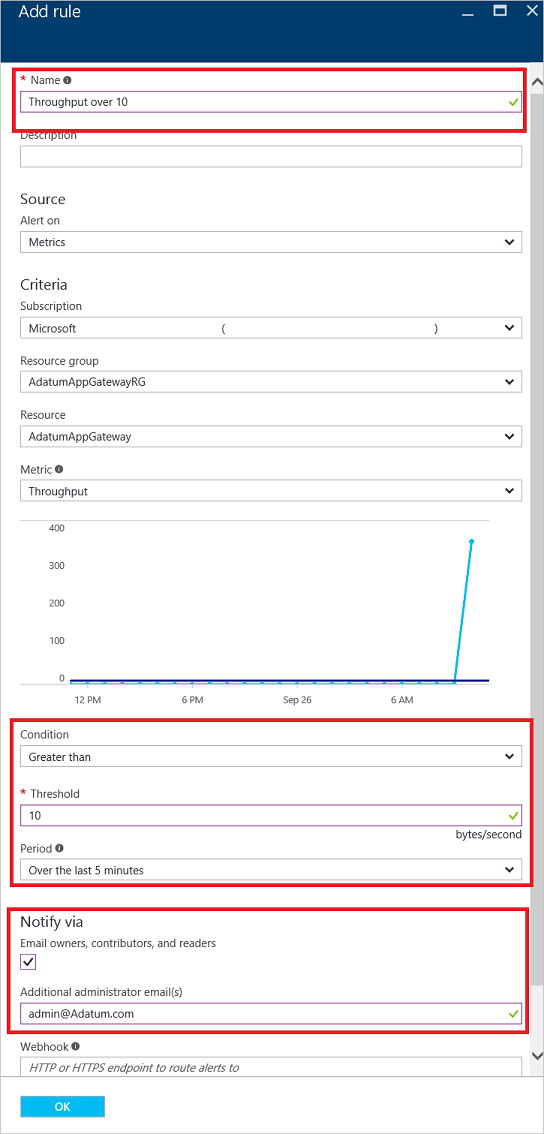
On the Add rule page, fill out the name, condition, and notify sections, and select OK.
In the Condition selector, select one of the four values: Greater than, Greater than or equal, Less than, or Less than or equal to.
In the Period selector, select a period from five minutes to six hours.
If you select Email owners, contributors, and readers, the email can be dynamic, based on the users who have access to that resource. Otherwise, you can provide a comma-separated list of users in the Additional administrator email(s) box.
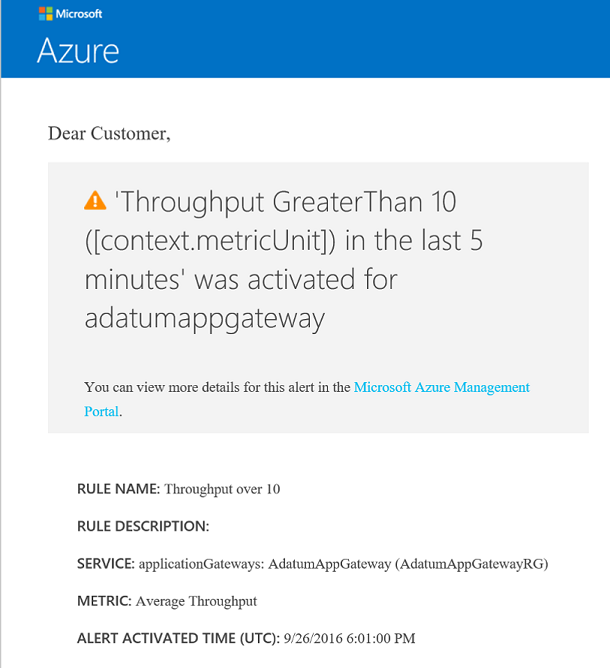
If the threshold is breached, an email that's similar to the one in the following image arrives:
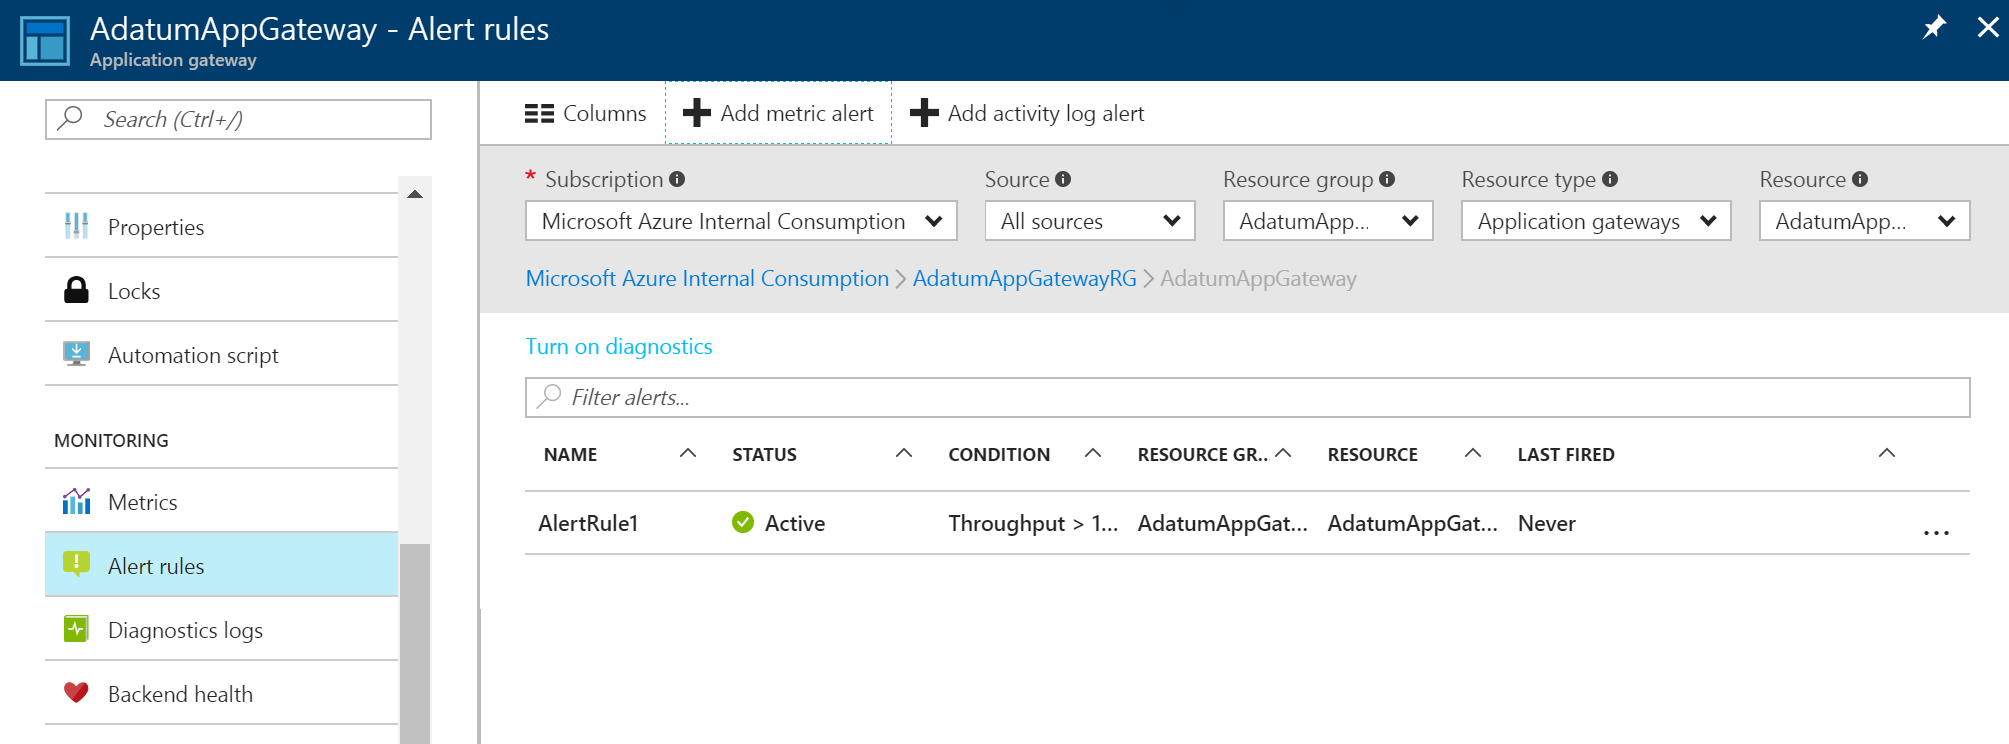
A list of alerts appears after you create a metric alert. It provides an overview of all the alert rules.
To learn more about alert notifications, see Receive alert notifications.
To understand more about webhooks and how you can use them with alerts, visit Configure a webhook on an Azure metric alert.
Next steps
- Visualize counter and event logs by using Azure Monitor logs.
- Visualize your Azure activity log with Power BI blog post.
- View and analyze Azure activity logs in Power BI and more blog post.