Azure Traffic Manager
An Azure service that is used to route incoming network traffic for high performance and availability.
111 questions
This browser is no longer supported.
Upgrade to Microsoft Edge to take advantage of the latest features, security updates, and technical support.
' cx='32' cy='32' r='32' /%3E%3Ctext x='50%25' y='55%25' dominant-baseline='middle' text-anchor='middle' fill='%23FFF' %3EA%3C/text%3E%3C/svg%3E)
In azure traffic manager if we choose Geographic routing,the request from a specific location is routed to specific endpoint .If the specific endpoint is down it automatically routes the request to next nearest location. Here i need to get an alert whenever this re-routing happens.Is this possible?
' cx='32' cy='32' r='32' /%3E%3Ctext x='50%25' y='55%25' dominant-baseline='middle' text-anchor='middle' fill='%23FFF' %3ECM%3C/text%3E%3C/svg%3E)
Hello @Anonymous ,
Thank you for reaching out.
I think you can set-up an endpoint failure alert instead in you traffic manager where you can monitor probe failures to determine if an endpoint has failed. Traffic Manager deploys multiple probes to increase resiliency. The threshold for probe statuses should be less than 0.5. If the average for up status falls below 0.5 (meaning less than 50% of probes are up) there should be an alert for an endpoint failure. You can set this alert up by following the documentation here.
Please let me know if you have any additional questions here. Thank you!
Hello,
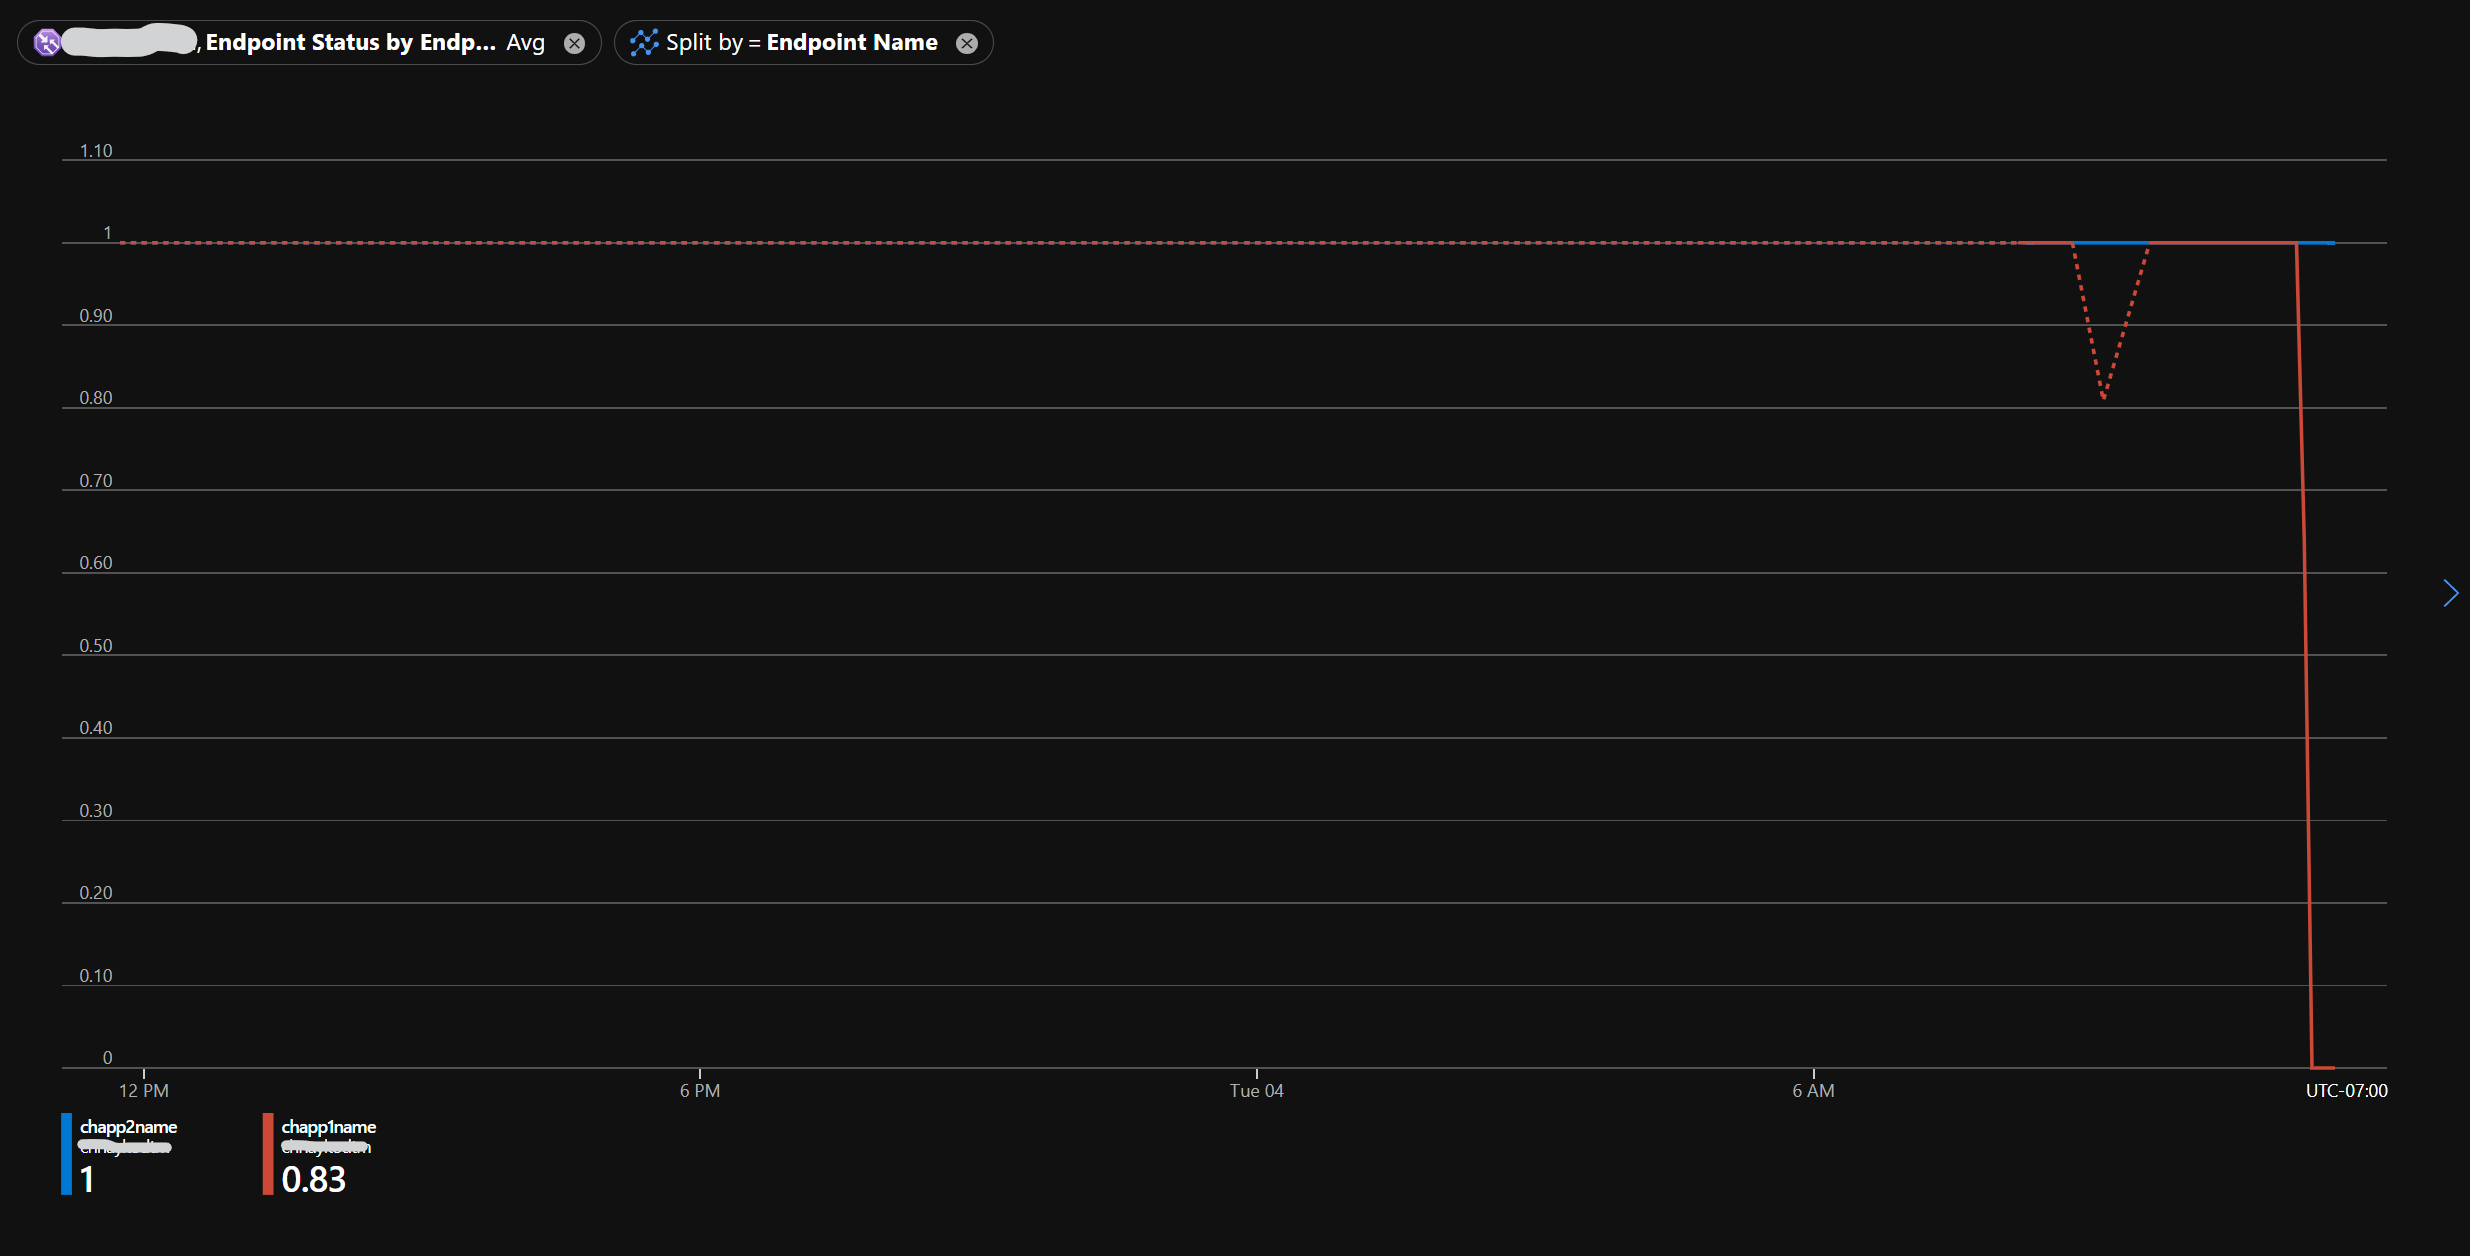
i have 2 endpoints India and US (Both endpoints are app services) . Every time india is down the traffic manager reroutes it to US.This is where i need an alert to trigger. Similarly when US endpoint is down the traffic manager routes it via india endpoint and there also there is an alert required to indicate that the particular endpoint is down.
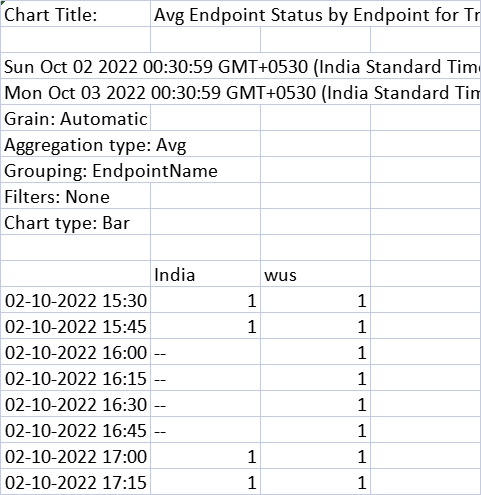
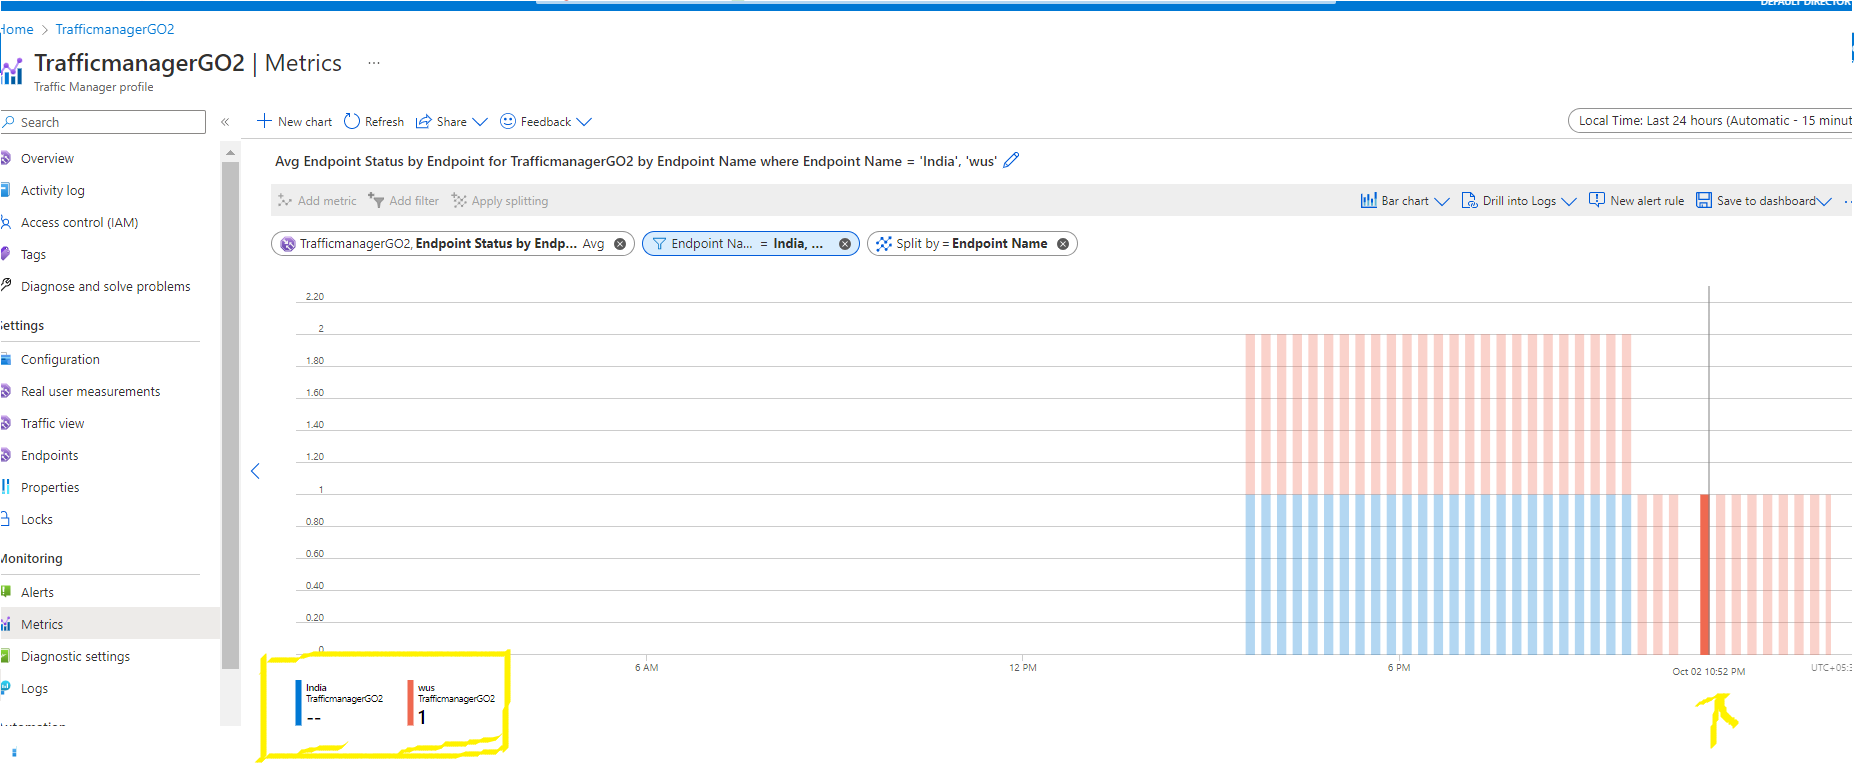
I tried using endpoint avg<0.5 but did not work . (When i stop the India app service ,the value is not displayed as 0 it shows - - and so the average value never 0.5 or less and trigger of alert never happens) Alert doesnt work.Image attached of same.
@ChaitanyaNaykodi-MSFT looking for your reply on above
Making this as an answer due to character limitations.
Hello @Anonymous , Thank you for reaching out, apologies for the delay.
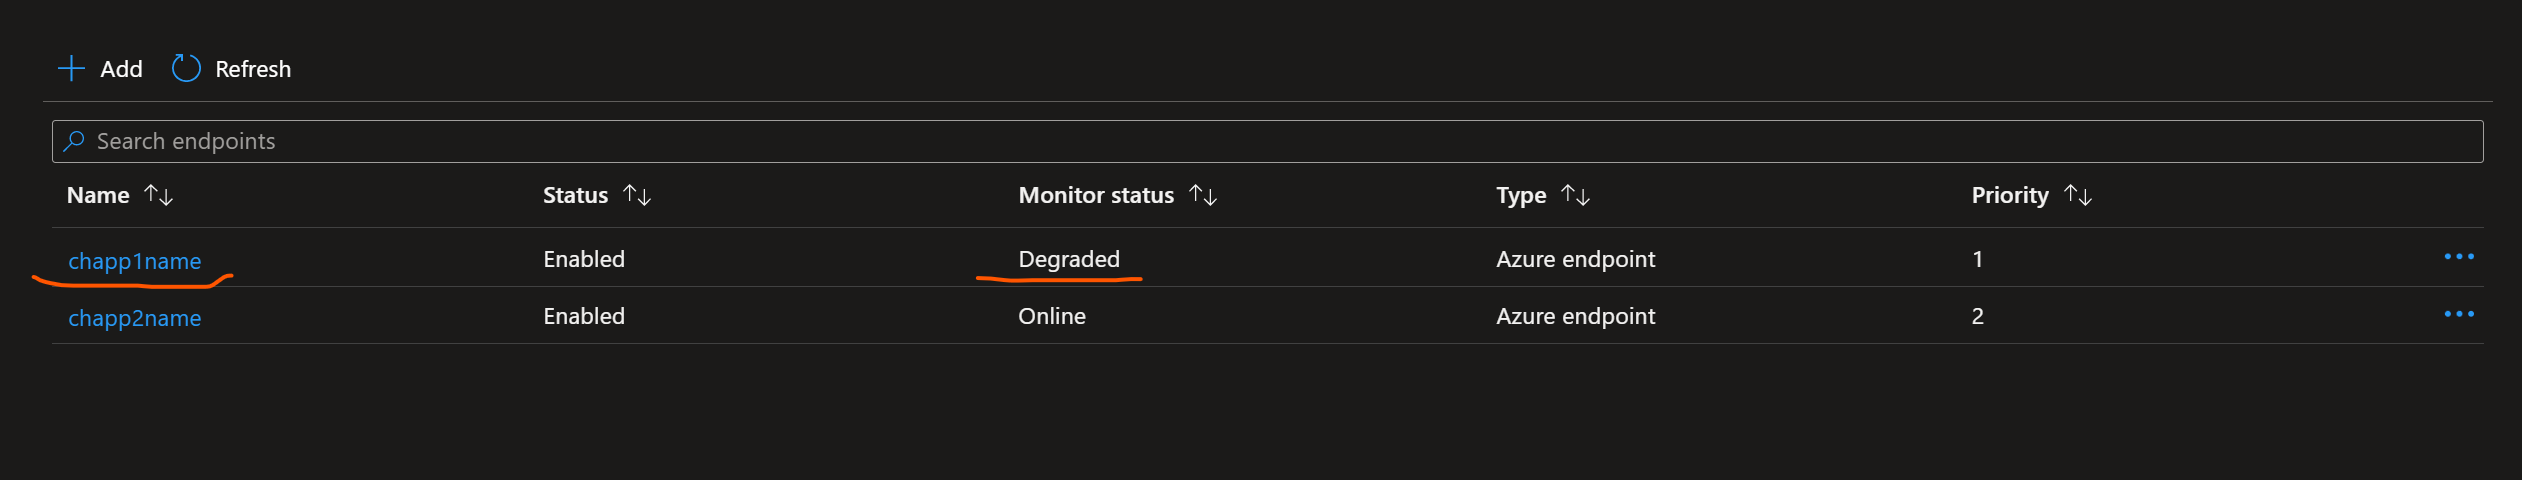
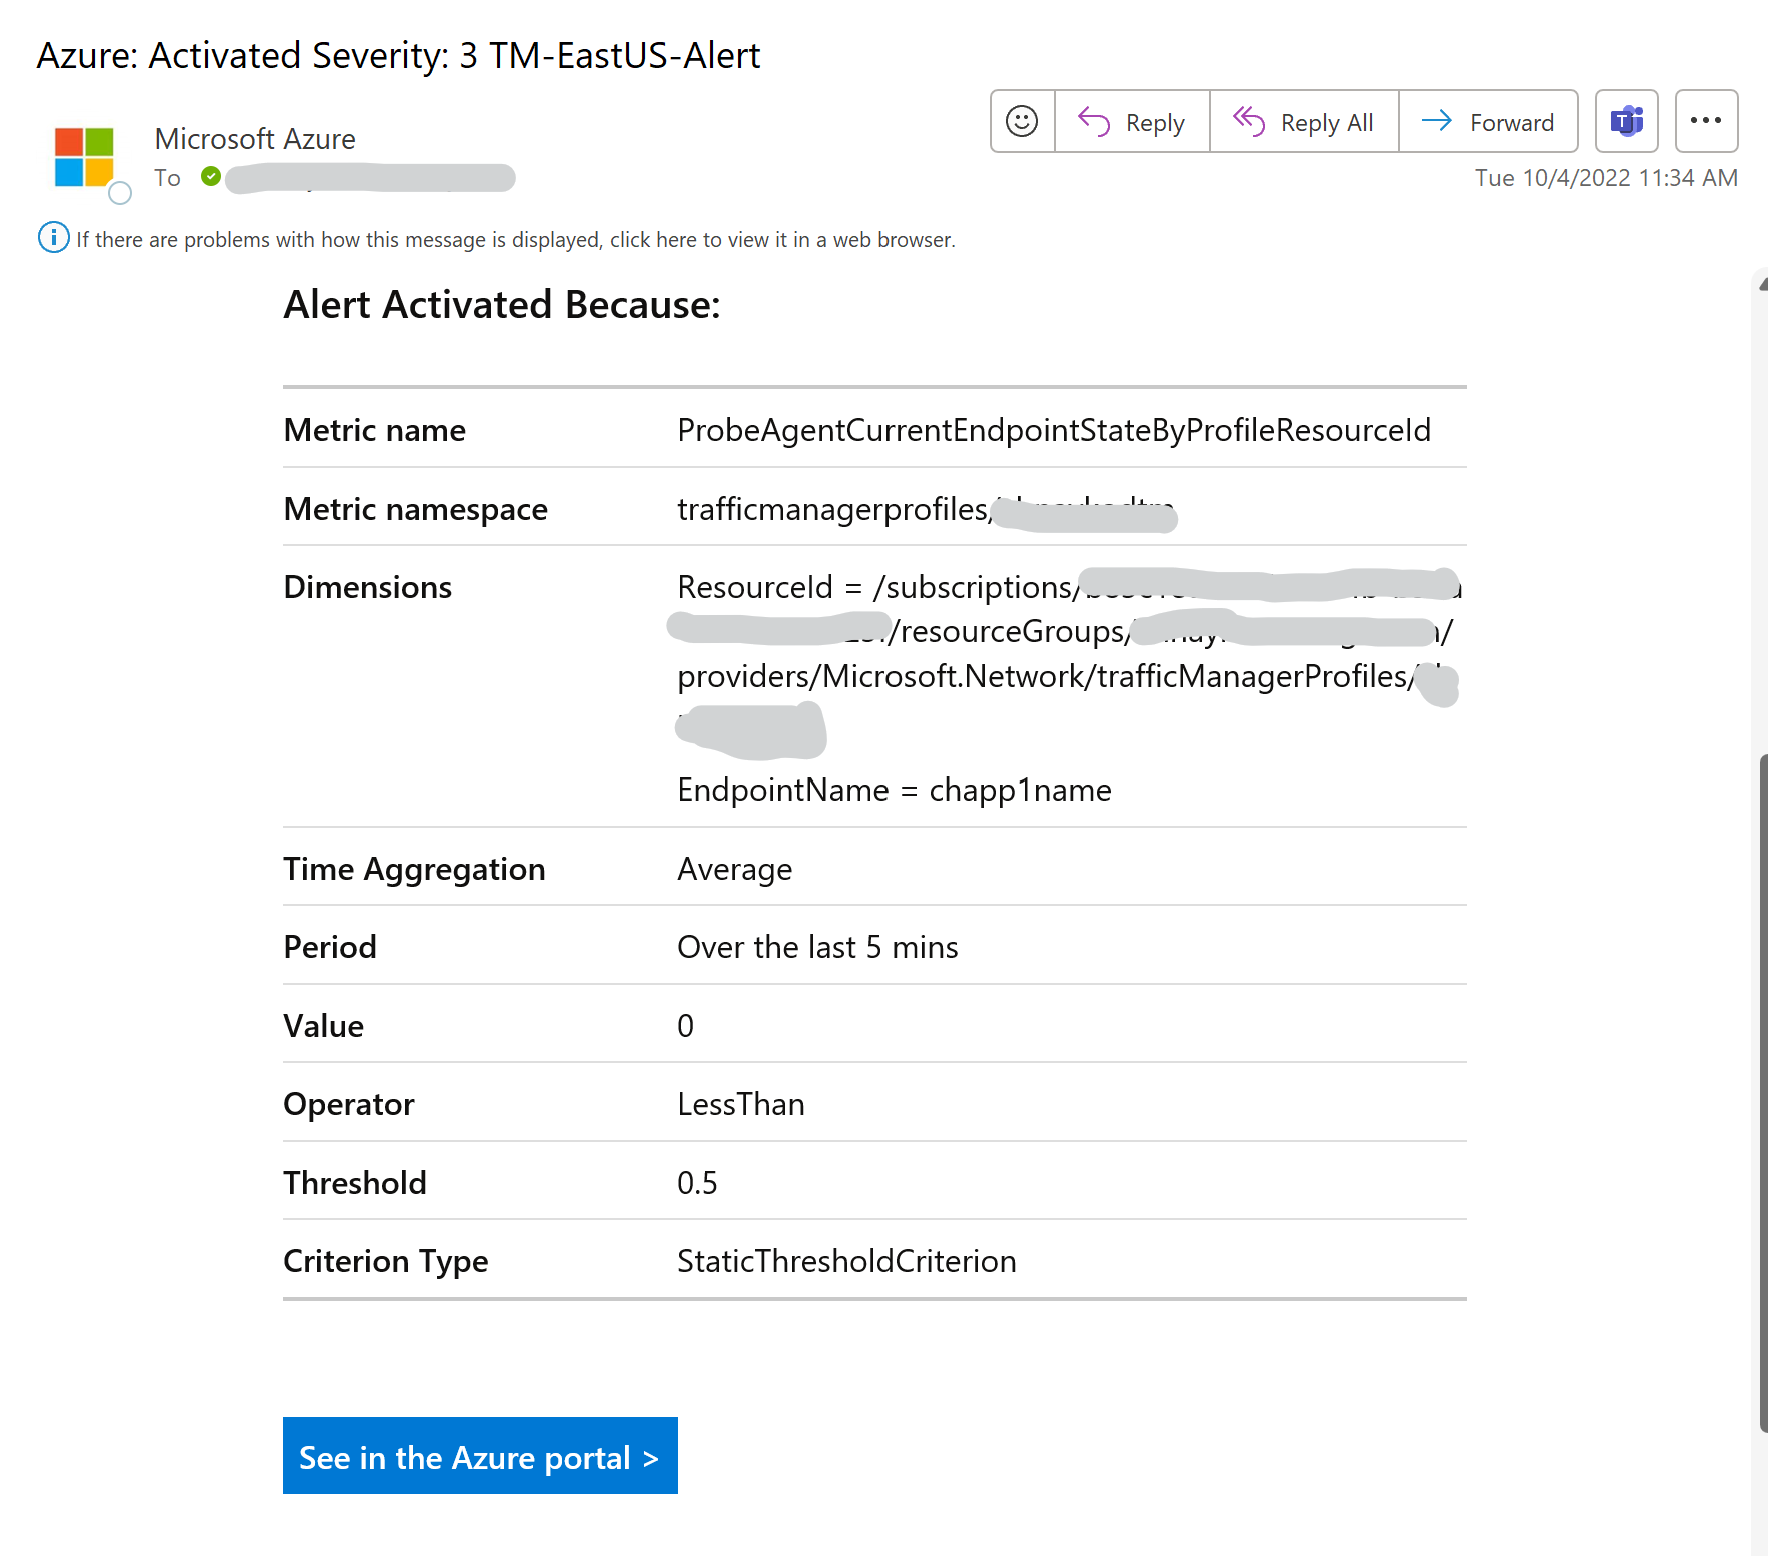
I tried a similar set-up on my end and was able to generate the alert when one of the backend web-app was in degraded state.
I think the issue observed here is due to the status of the backend web as mentioned by you above the app service was in stopped state. As per the documentation here
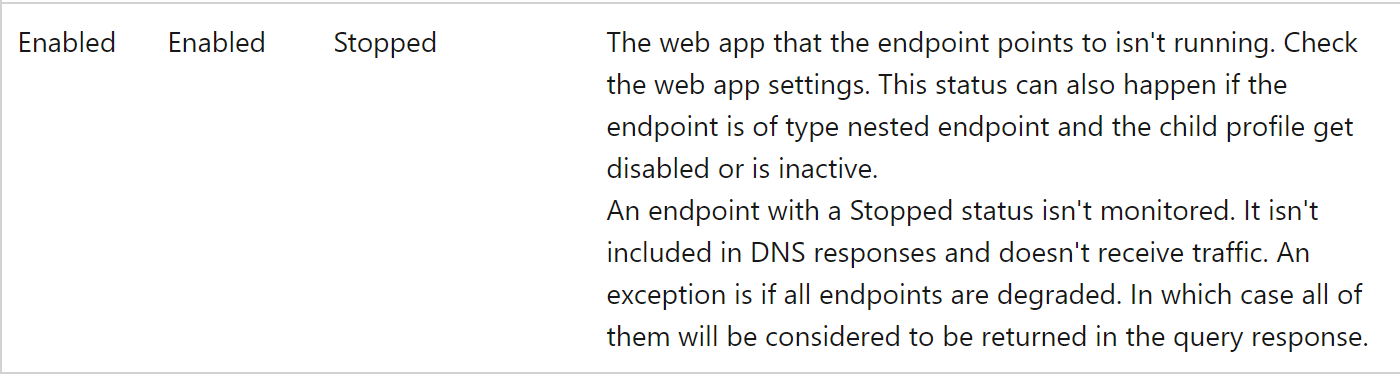
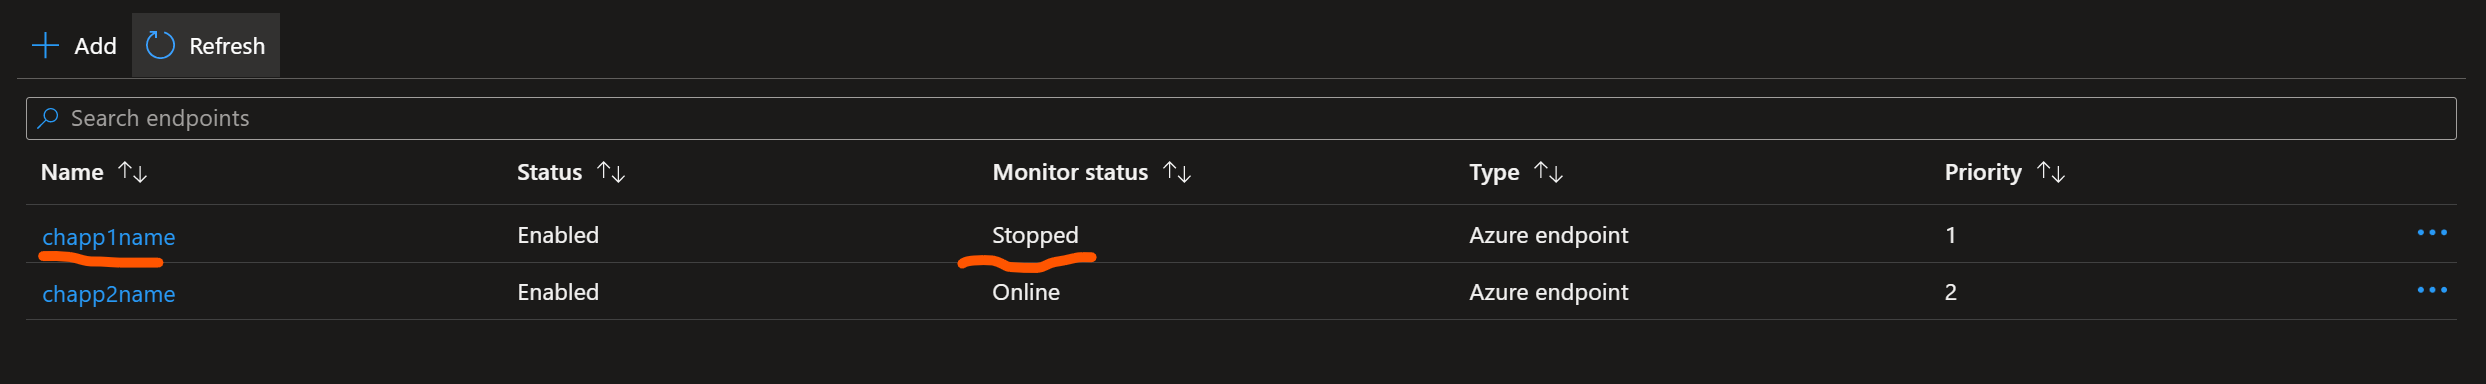
An endpoint with a Stopped status isn't monitored. When App Service endpoints are added to an Azure Traffic Manager profile, Azure Traffic Manager keeps track of the status of your App Service apps (running, stopped, or deleted) so that it can decide which of those endpoints should receive traffic.
For example, when I stopped my web-app above the Monitor status immediately changed to stopped.
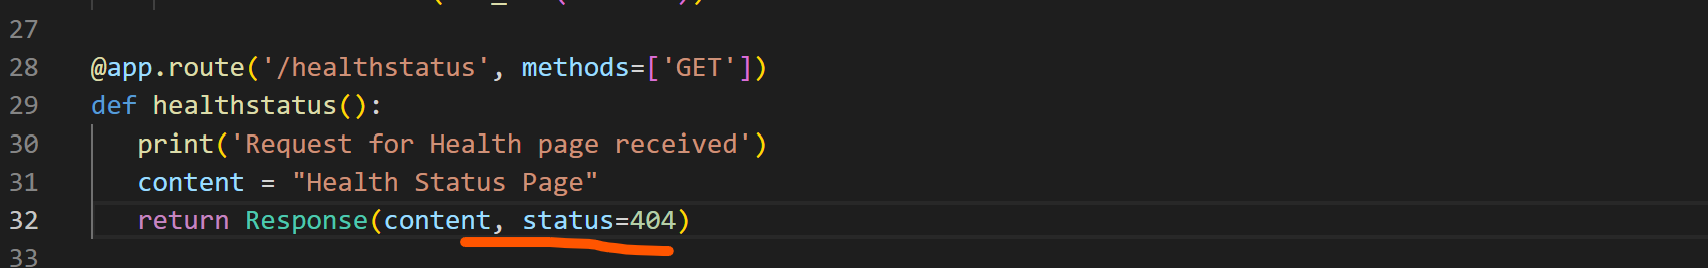
In order to test this scenario, I think you can set-up a probe path in such a way that it can return a non-200 response when configured to do so.
As per the documentation here. A best practice is to set the probe path to something that has enough logic to determine that the site is up or down. In the previous example, by setting the path to "/favicon.ico", you are only testing that w3wp.exe is responding. This probe may not indicate that your web application is healthy. A better option would be to set a path to a something such as "/Probe.aspx" that has logic to determine the health of the site. For example, you could use performance counters to CPU utilization or measure the number of failed requests. Or you could attempt to access database resources or session state to make sure that the web application is working.
I tried this using a simple test app at my end where I set the /healthstatus as my probe path and I manipulated the status code to test the alerts.
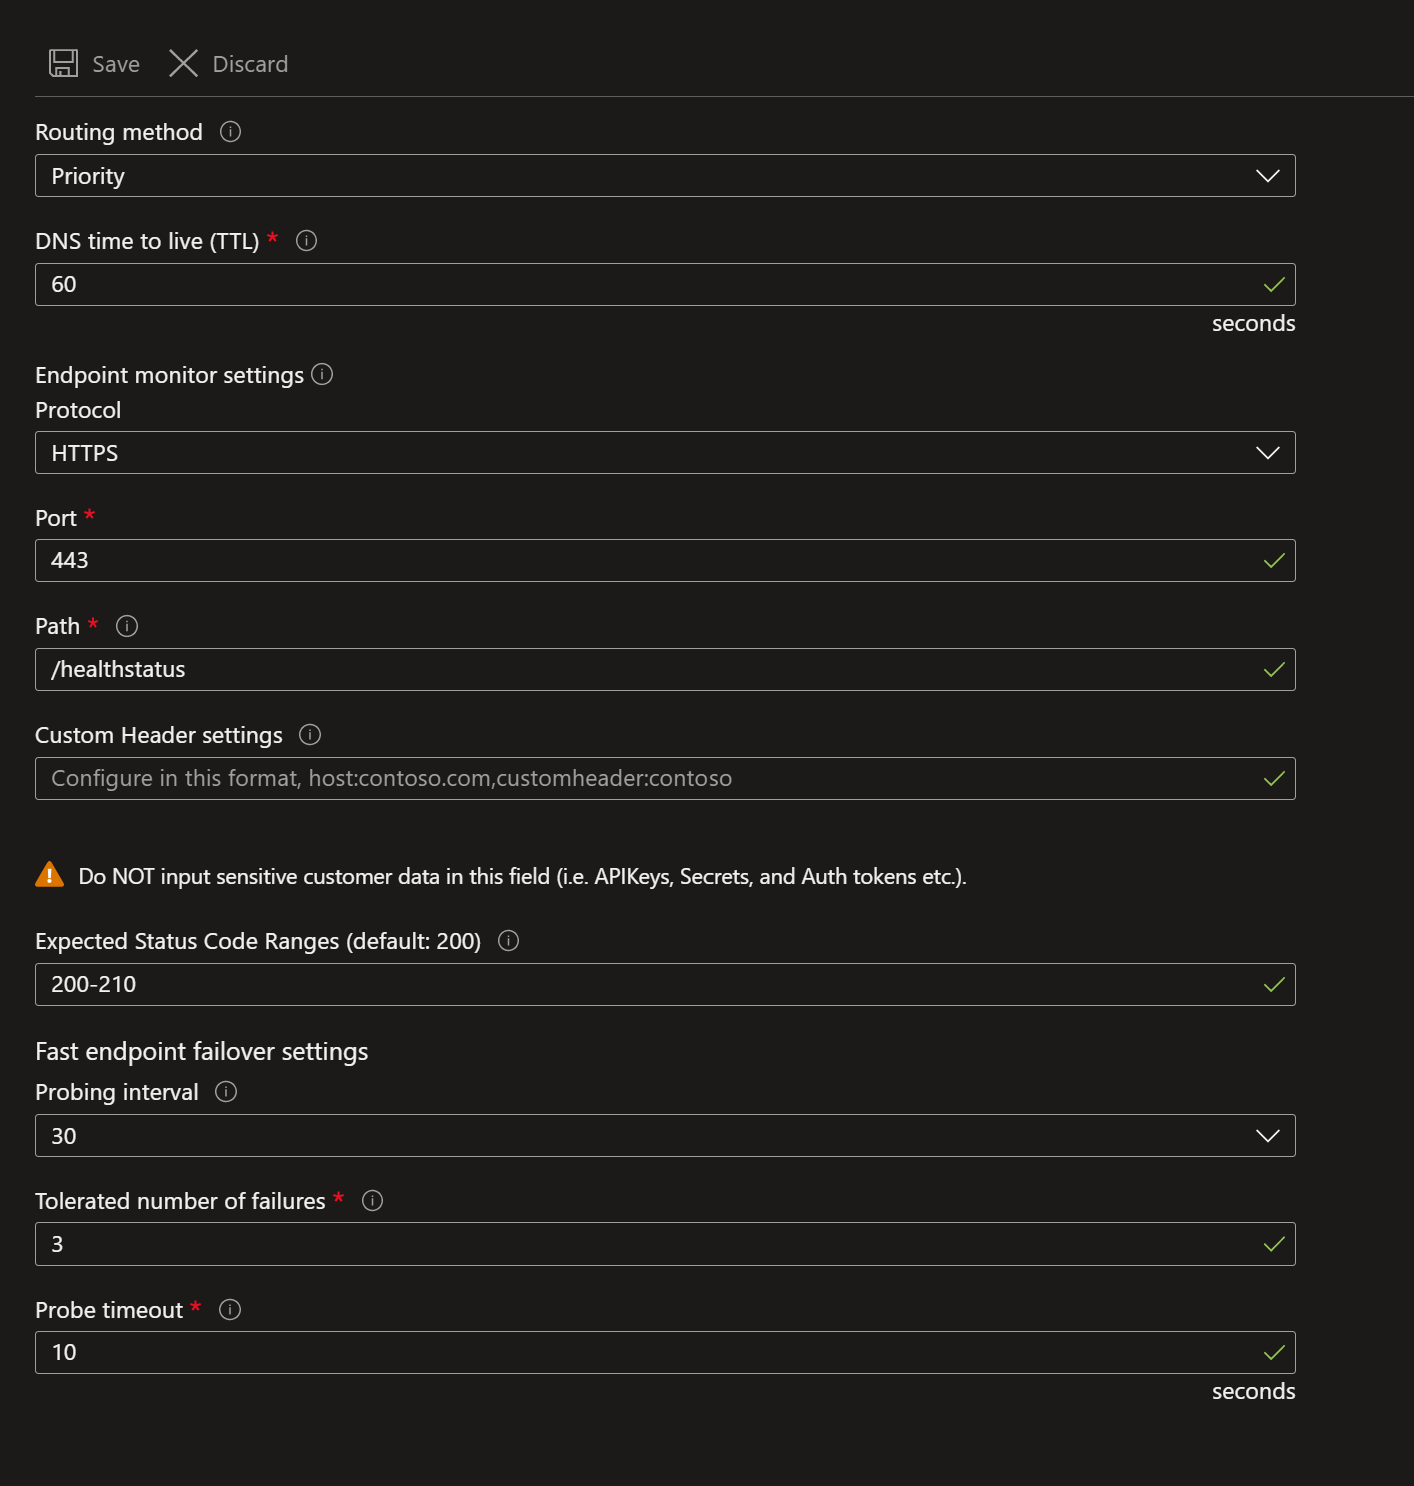
Hope this helps! Please let me know if you have any additional questions. Thank you!