Azure Databricks
An Apache Spark-based analytics platform optimized for Azure.
2,175 questions
This browser is no longer supported.
Upgrade to Microsoft Edge to take advantage of the latest features, security updates, and technical support.
' cx='32' cy='32' r='32' /%3E%3Ctext x='50%25' y='55%25' dominant-baseline='middle' text-anchor='middle' fill='%23FFF' %3ERB%3C/text%3E%3C/svg%3E)
Hi,
I want to monitor Azure Databricks using Azure monitor .. I first want to send all its diagnostics settings to log analytics and then i can analyze from there.
but there is no diagnostics setting feature Available for "Azure databricks Standard version "'. i got one document in which it says that azure databricks monitoring is only available for "Databricks Premium Plan"..
My Question is like :
1) How can we monitor databricks in azure monitor - if so is that recommended approch bcoz we want to use this in our production env.
2) Difference between standard and premium azure plans..
3) Can u send me any gif document which shows - steps to monitor azure databricks using log analytics
4) If i have premium databricks then will i be able to monitor my databricks nodes, cluster, pools, jobs and most important No of executor and their memory utilization.
Regards,
Rohit

Hello @Rohit Boddu ,
Why we don't have diagnostic settings feature in Monitoring Section of "Azure Databricks of standard version."
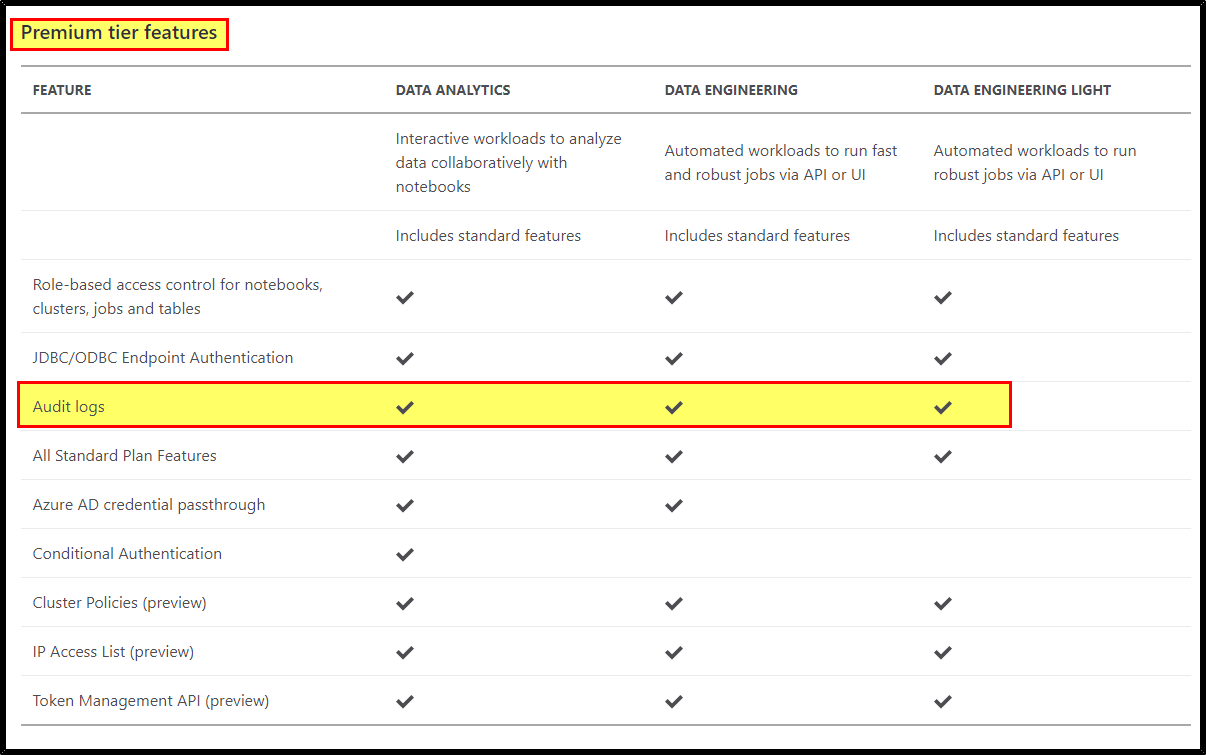
Azure Databricks Standard version don’t have option to enable diagnostic settings feature.
Reason: Audit logs feature is only available in Premium tier.
How can we monitor databricks in azure monitor - if so is that recommended approch bcoz we want to use this in our production env.
Monitoring is a critical part of any production-level solution, and Azure Databricks offers robust functionality for monitoring custom application metrics, streaming query events, and application log messages. Azure Databricks can send this monitoring data to different logging services.
For more details, refer “Monitoring Azure Databricks”.
Difference between standard and premium azure plans.
The Azure Databricks pricing page gives you difference between both the plans.
And also, refer Azure Databricks Standard vs. Premium in detail.
Can u send me any gif document which shows - steps to monitor azure databricks using log analytics?
This article “Diagnostic logging in Azure Databricks" provides end-to-end steps to monitor Azure Databricks using Log Analytics”.
If i have premium databricks then will i be able to monitor my databricks nodes, cluster, pools, jobs and most important No of executor and their memory utilization.
With Azure Databricks provides diagnostic logs for the following services:
You can configure an Azure Databricks cluster to send metrics to a Log Analytics workspace in Azure Monitor, the monitoring platform for Azure.
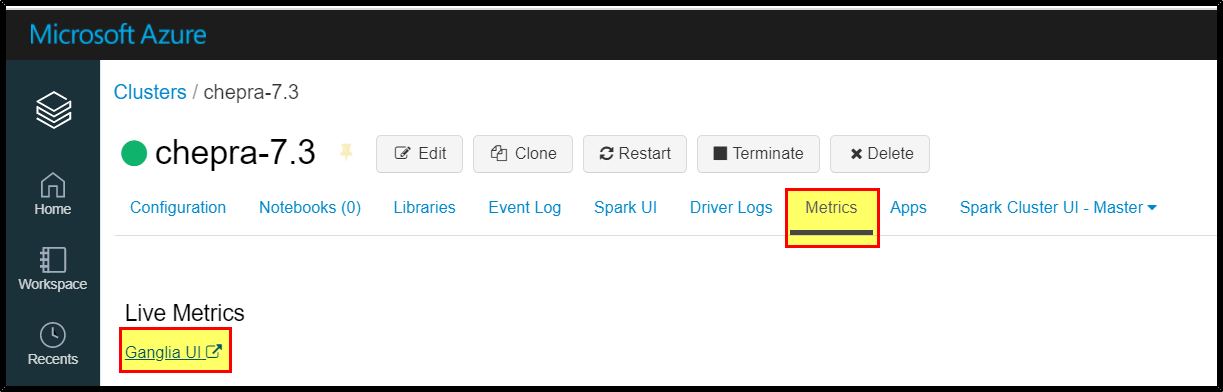
To help you monitor the performance of Azure Databricks clusters, Azure Databricks provides access to Ganglia metrics from the cluster details page.
You can also install Datadog agents on cluster nodes to send Datadog metrics to your Datadog account.
Reference: Azure Databricks – Monitor performance
Hope this helps. Do let us know if you any further queries.
------------
Hello @Rohit Boddu ,
Just checking in to see if the above answer helped. If this answers your query, do click “Accept Answer” and Up-Vote for the same. And, if you have any further query do let us know.
Hello @Rohit Boddu ,
Following up to see if the above suggestion was helpful. And, if you have any further query do let us know.
Take care & Stay safe!