Hi,
I created a measure to calculate sell-through by Section, and I was hoping to show all of the sections with their corresponding sell-through. This measure works properly in the visual when I select a section with the slicer because I used the ALLSELECTED() function in my logic, seen below:
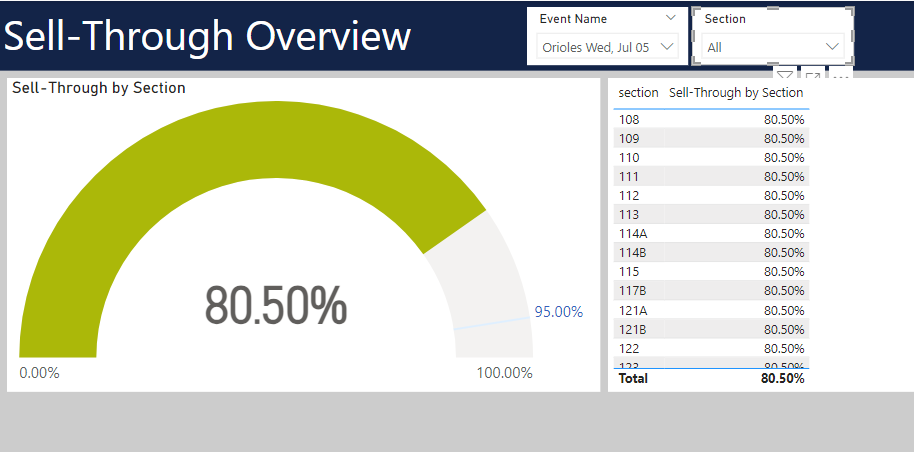
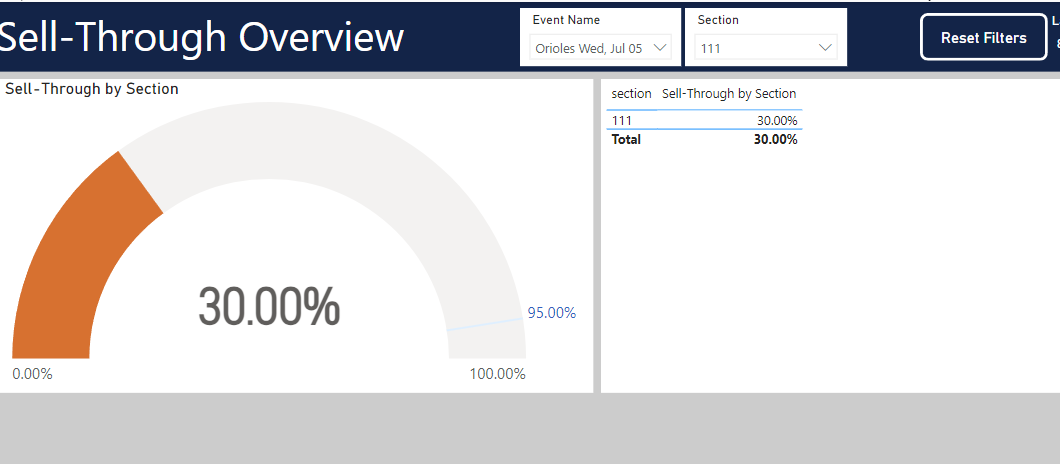
Quantity Sold by Section = CALCULATE([Quantity Sold], ALLSELECTED(xyz[section], xyz[Event Name]))
Quantity Unsold by Section = CALCULATE([Quantity Unsold], ALLSELECTED(xyz[section], xyz[Event Name]))
Sell-Through by Section = ([Quantity Sold by Section] / ([Quantity Unsold by Section] + [Quantity Sold by Section]))
' cx='32' cy='32' r='32' /%3E%3Ctext x='50%25' y='55%25' dominant-baseline='middle' text-anchor='middle' fill='%23FFF' %3EDG%3C/text%3E%3C/svg%3E)