@Spitzer, Liz ,
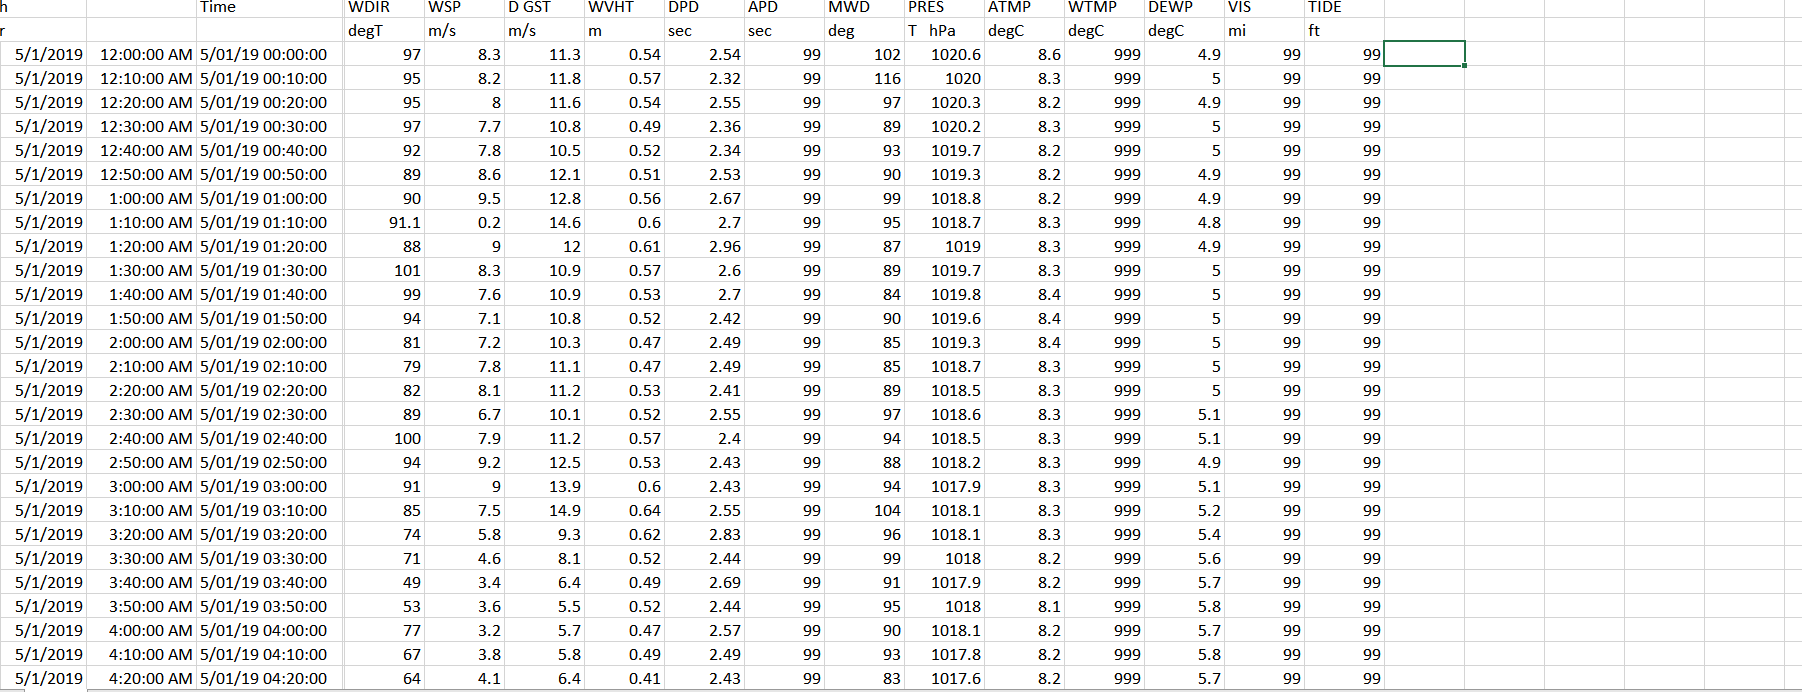
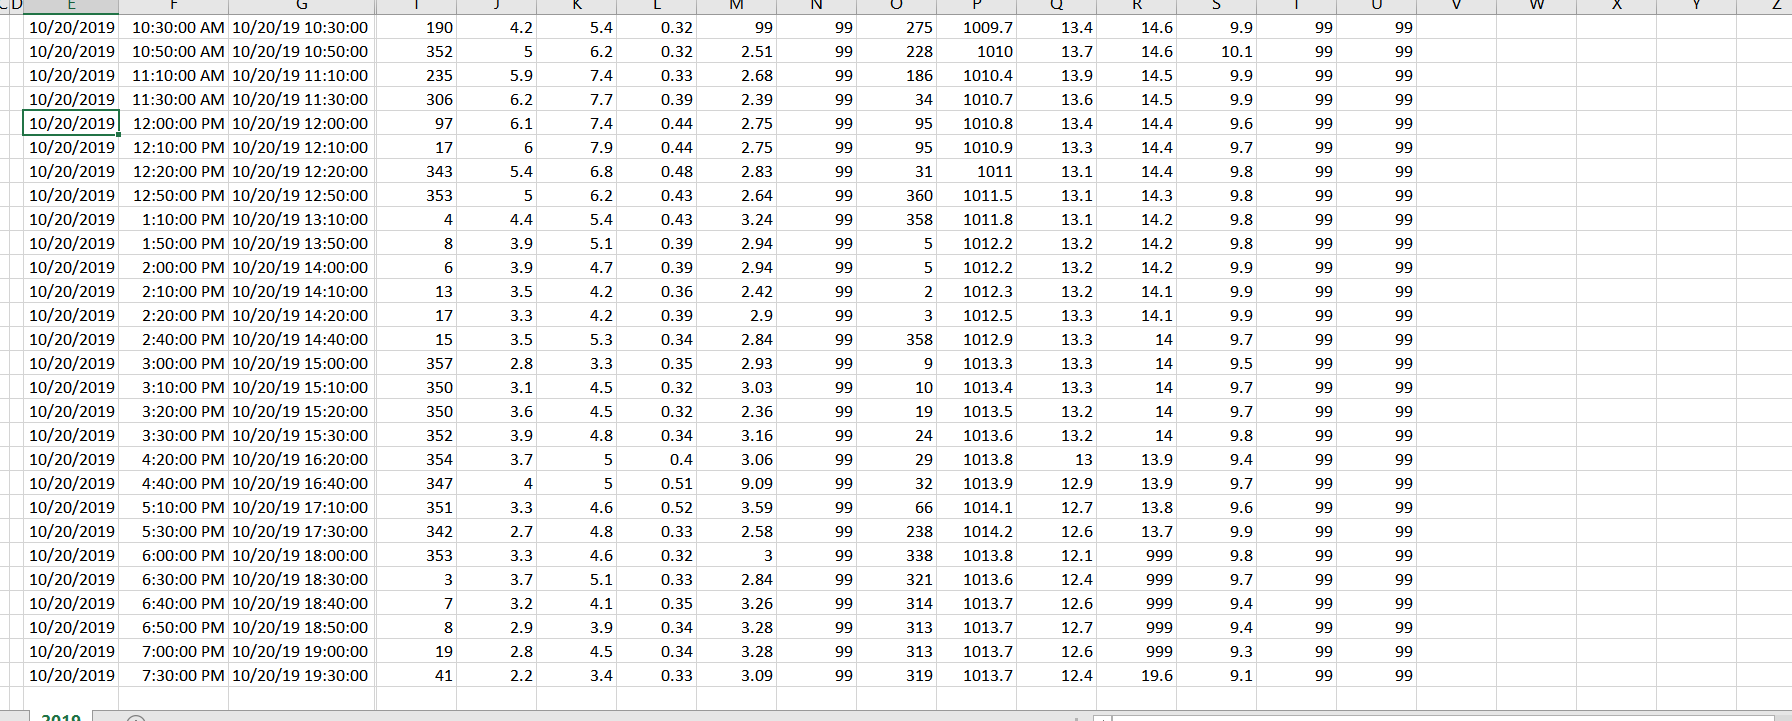
According to the images, is the data of "WVHT" the wave height values?
If so, I made a brief sample, and I would get an average value for every day via following 2 ways.
Sample:
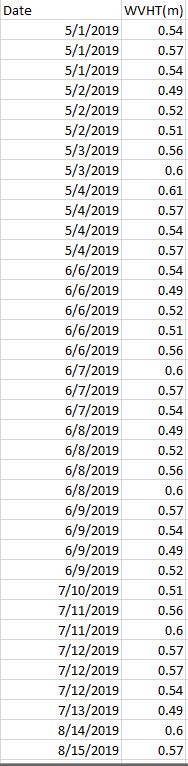
1
- Right click all data > Get Data from Table/Range > check the range of data which should be include headers, select the box of "My table has headers".
- Select Date column > Home > Transform group > Date Type: Date > Replace Current.
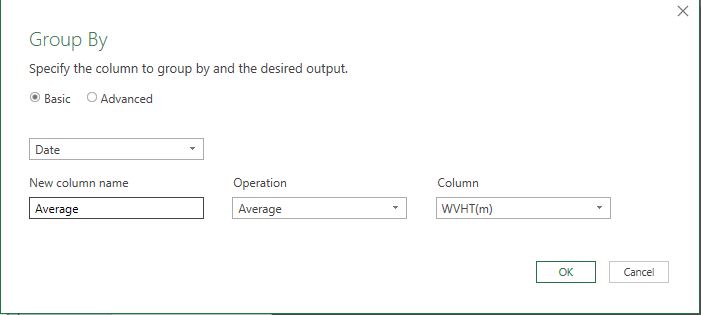
- Then go to Group By > Choose "Basic" and group by “Date” cloumn, name a new column (Here I call it as "Average Value"), and then choose "Average" as Operation and "WVHT(m)" as caulation column > Click OK.
- Then I get the result below.
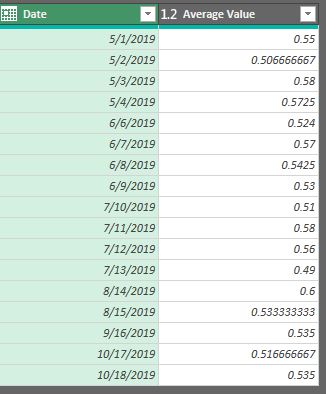
Click File > Close & Load To > Table > Choose New Worksheet or Existing Worksheert to show the table > Click OK.
2
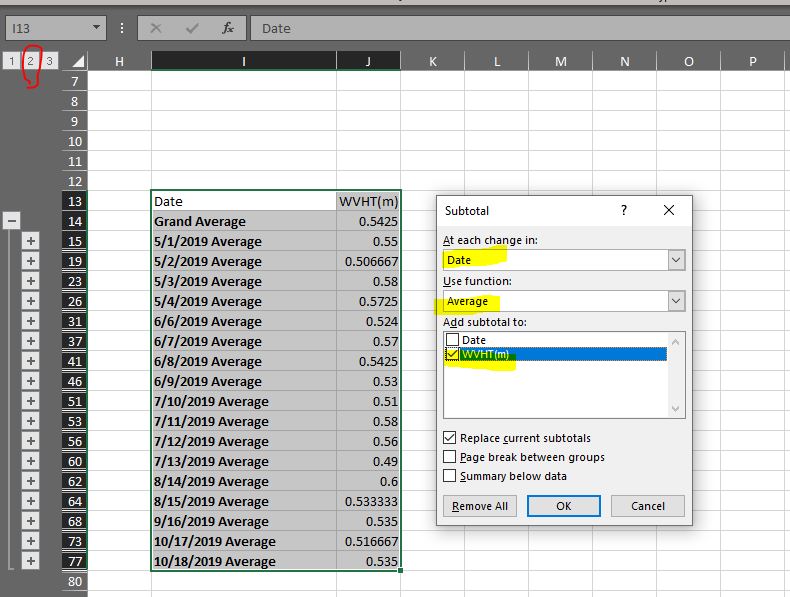
If you do not want to use Power Query, you may also use Subtotal.
Select the data, go to Data > Outline group > Subtoatl, set as the following picture. If needed, you may also click the "Level 2" to just show the average value.
Any misunderstanding, please let me know.
If an Answer is helpful, please click "Accept Answer" and upvote it.
Note: Please follow the steps in our documentation to enable e-mail notifications if you want to receive the related email notification for this thread.
' cx='32' cy='32' r='32' /%3E%3Ctext x='50%25' y='55%25' dominant-baseline='middle' text-anchor='middle' fill='%23FFF' %3ESL%3C/text%3E%3C/svg%3E)