Elapsed Time in QEP returned from sys.dm_exec_query_plan_stats is different from the one in Actual Execution Plan returned by SSMS

Andrea D'Elia 20 Reputation points
2024-07-09T09:57:58.9866667+00:00

I am trying to use the LAST_QUERY_PLAN_STATS property to save the QEP Actual of each executed statement in my repository, using DMV sys.dm_exec_query_plan_stats I am able to intercept it and save it without any problems.

However, when I open one of them to check the elapsed timer in the properties tab, I find an elapsed times different from the ones found in statistics and in the QEP Actual requested at run time.

Am I reading them wrong or it's an expected behavior? Do you have any ideas?

I can reproduce it with a simple script:

My script with statistics time
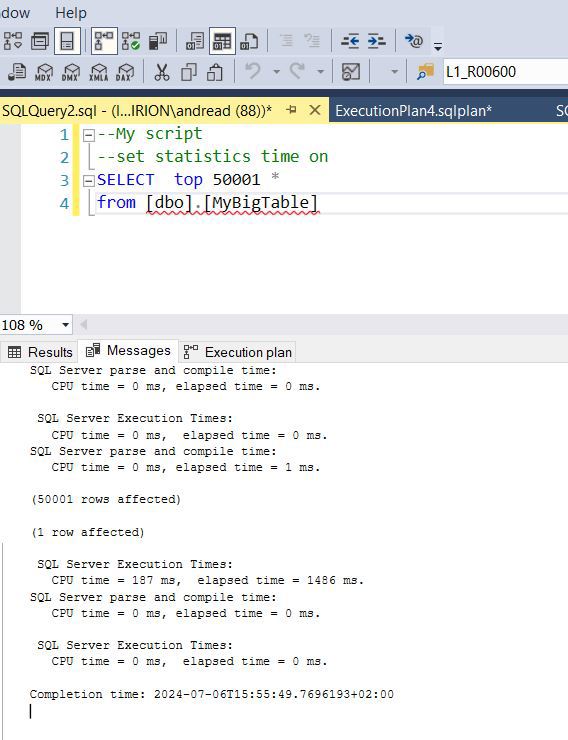
Query

The same script, but the tab with Execution plan requested run time
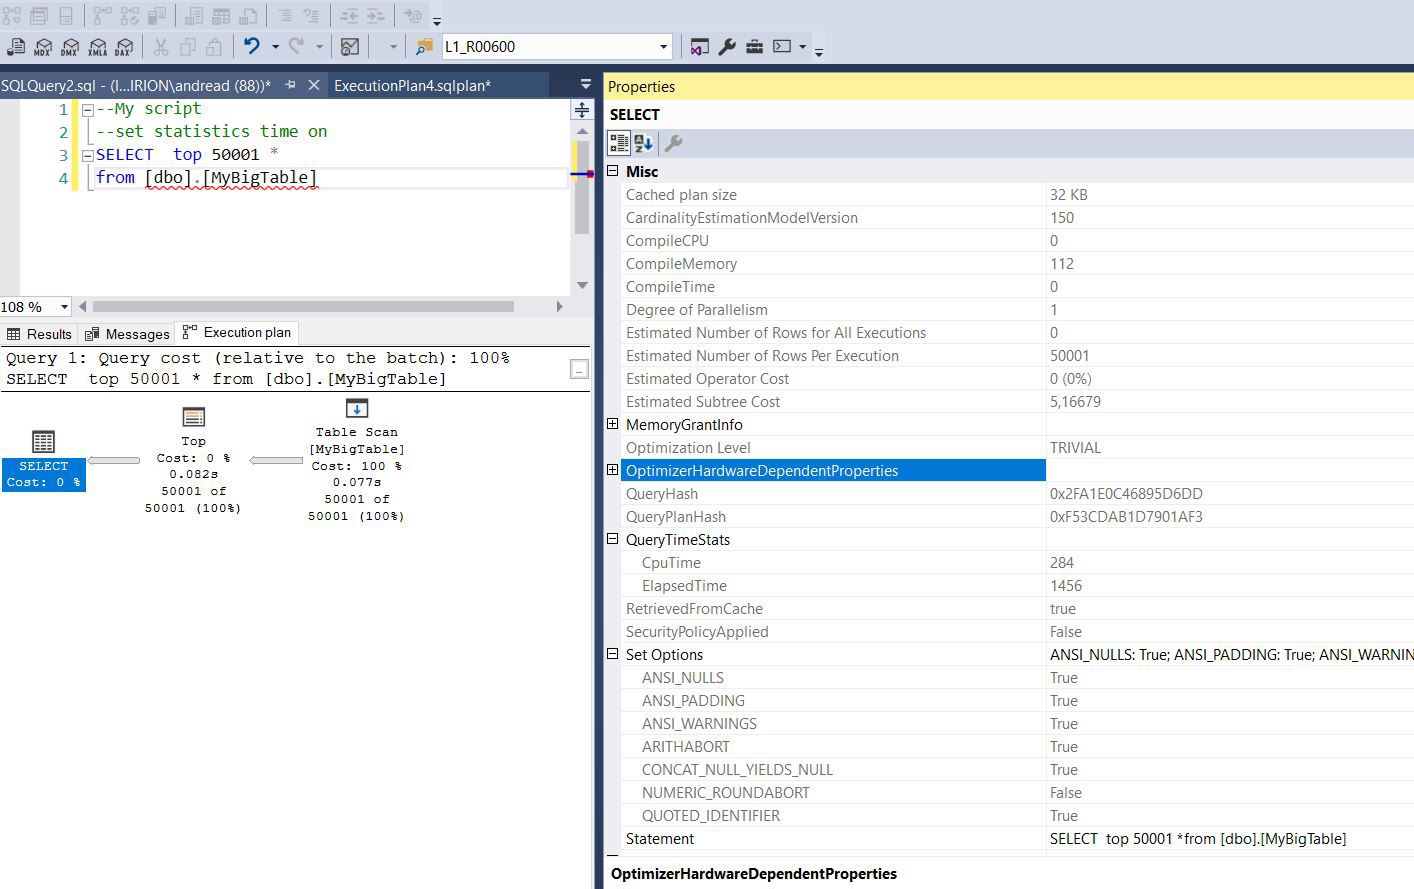
QueryQEP

Here is how I obtained the QEP from sys.dm_exec_query_plan_stats:

select
   [qt].[text],
   [query_plan] = (SELECT TOP 1 [query_plan] FROM sys.dm_exec_query_plan_stats (a.[plan_handle])),
   [last_elapsed_time] = a.[last_elapsed_time] / 1000.0,
   a.[last_execution_time]
from (
SELECT *
FROM sys.dm_exec_query_stats qs
WHERE creation_time > '2024-07-01 08:00:00') a
CROSS APPLY (SELECT * FROM sys.dm_exec_sql_text(a.[plan_handle]) t ) qt
WHERE qt.[text] LIKE '--My script%'
order by 4 desc

This is the QEP, with the strange Elapsed Time:
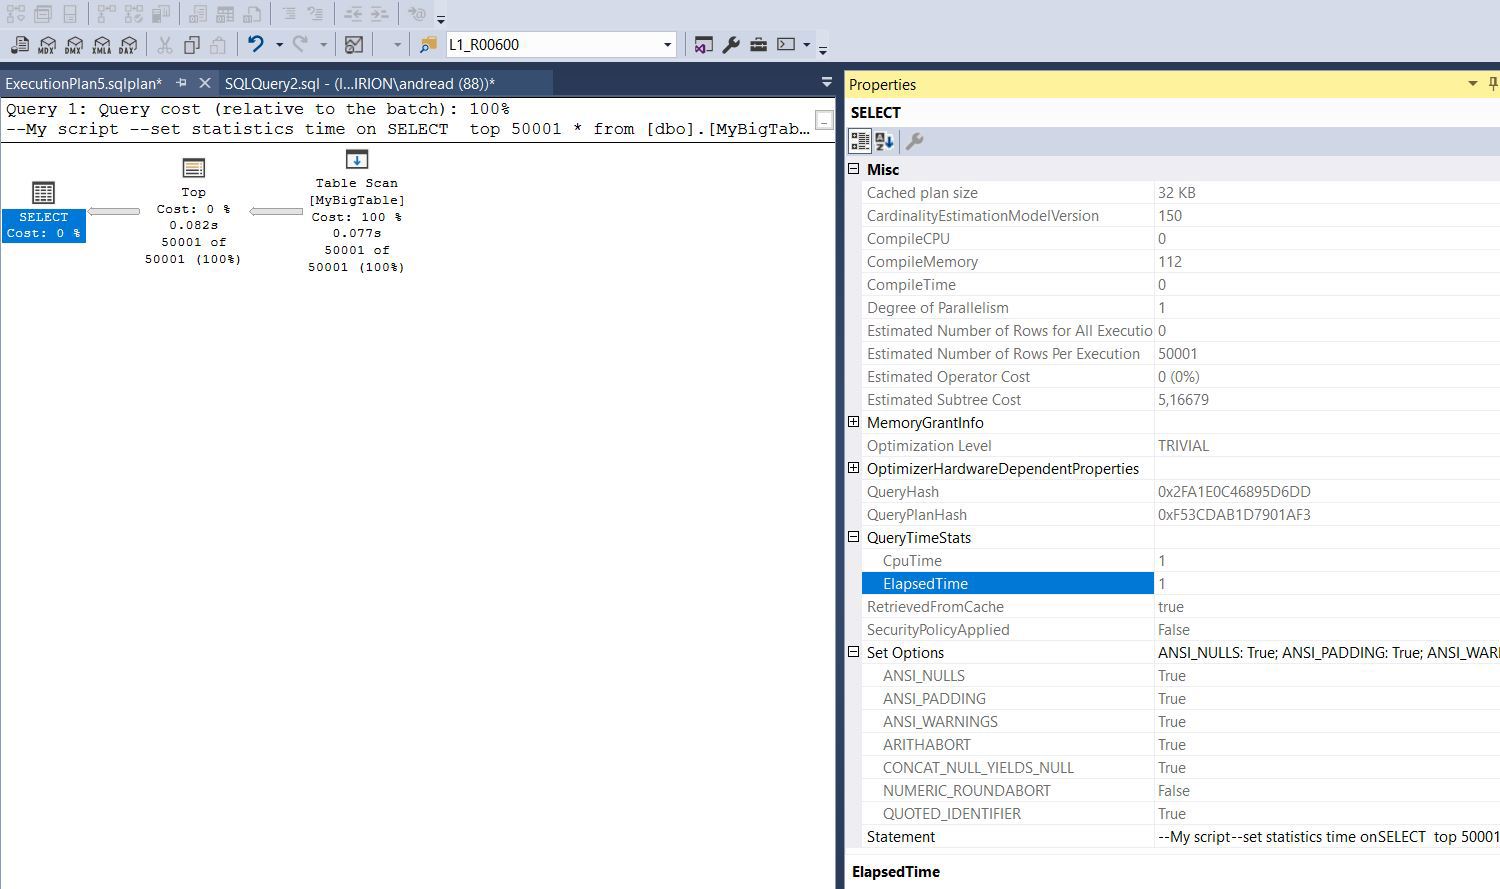
LastQEPActualTime

This is the comparison, when we can see that the two QEP are identical so I don't get why they have different Elapsed Time
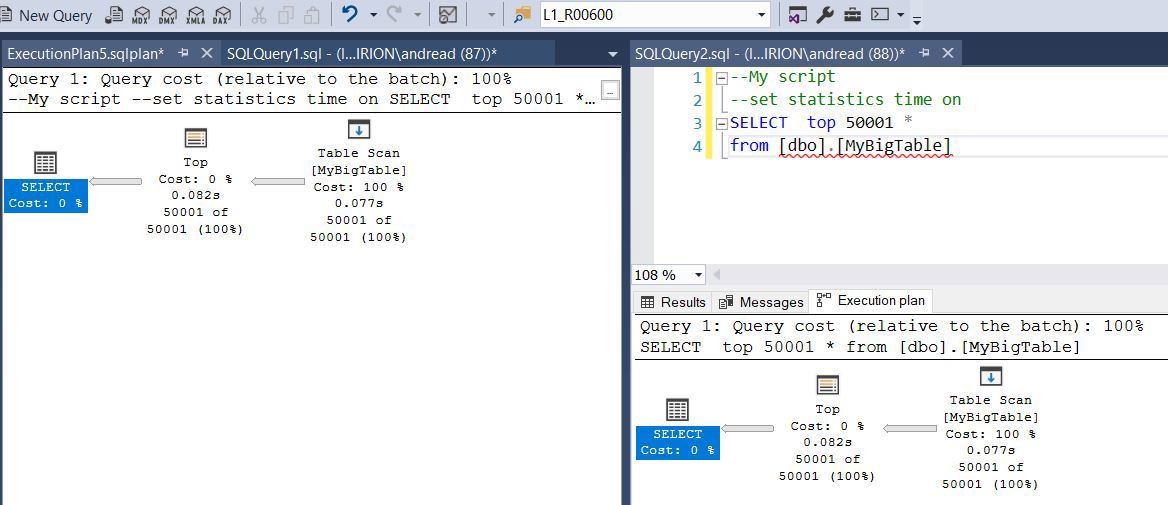
Confronto

SQL Server
SQL Server
A family of Microsoft relational database management and analysis systems for e-commerce, line-of-business, and data warehousing solutions.
13,334 questions
0 comments No comments
{count} votes

Accepted answer
  1. Erland Sommarskog 106.6K Reputation points
    2024-07-09T21:35:10.2733333+00:00

    No need to fiddle with LAST_QUERY_PLAN_STATS. You can see this difference with just enabling actual execution plan and run the query.

    There is a very simple reason for the big difference you get. It is called SSMS. That is, it takes time to collect and render all those rows. And that time is included in the total execution time. However, the query execution ends much earlier.

    I would recommend that you try this with a more complex query that produces less output. Or for that matter, change the query to SELECT INTO. There will still be a difference, but not that radical


1 additional answer

Sort by: Most helpful
  1. LiHongMSFT-4306 25,651 Reputation points
    2024-07-10T02:55:33.6066667+00:00

    Hi @Andrea D'Elia

    Refer to this doc: sys.dm_exec_query_plan_stats (Transact-SQL)

    When the query is simple enough, it is usually categorized as part of an OLTP workload.

    A simplified Showplan output is returned in the column of the returned table for: query_plansys.dm_exec_query_plan_stats

    Try some queries that are complex enough.

    Best regards,

    Cosmog Hong


    If the answer is the right solution, please click "Accept Answer" and kindly upvote it. If you have extra questions about this answer, please click "Comment".

    0 comments No comments