Azure Monitor
An Azure service that is used to collect, analyze, and act on telemetry data from Azure and on-premises environments.
2,968 questions
This browser is no longer supported.
Upgrade to Microsoft Edge to take advantage of the latest features, security updates, and technical support.
' cx='32' cy='32' r='32' /%3E%3Ctext x='50%25' y='55%25' dominant-baseline='middle' text-anchor='middle' fill='%23FFF' %3ENP%3C/text%3E%3C/svg%3E)
I currently have a dashboard setup to view the bits per second in/out of my express route however it doesn't allow me to go deeper and see what's traversing my express route. I want to know how I can set up my environment to see this? Example: if I see my bits per second reach 400MB out of 500MB, what sources are causing such high throughput?
Any help is appreciated. Thank you.

Hello @Nicole Pacheco ,
Just checking in to see if the below answer helped. If this answers your query, please don’t forget to click "Accept the answer" and Up-Vote for the same, which might be beneficial to other community members reading this thread. And, if you have any further query do let us know.
Thanks,
Gita
Hello @Nicole Pacheco ,
Could you please provide an update on this post?
Kindly let us know if the below answer helps or you need further assistance on this issue.
----------------------------------------------------------------------------------------------------------------
Please don’t forget to close the thread by clicking "Accept the answer" wherever the information provided helps you, as this can be beneficial to other community members.
Hello @Nicole Pacheco ,
To monitor the performance of Azure ExpressRoute, you can use the cloud-based hybrid network monitoring solution named Network Performance Monitor.
NPM (Network Performance Monitor) can monitor the packet loss and network latency between your on-premises resources and Azure VNETs connected through an ExpressRoute. You can setup alerts to get proactively notified whenever the loss or latency crosses the threshold.
With NPM, you can get end-to-end visibility into the ExpressRoute connection. Since an ExpressRoute connection comprises of various components, it is extremely difficult to identify the bottleneck when high latency is experienced while connecting to an Azure workload. With NPM, you can get the required end-to-end visibility through NPM’s interactive topology view. You can not only view all the constituent components, your on-premises network, circuit provider edge, ExpressRoute circuit, Microsoft edge, and Azure VMs, but also the latency contributed by each hop to help you identify the troublesome segment. You can also choose to expand the map to view all the on-premises hops and understand the latency contributed by each hop.
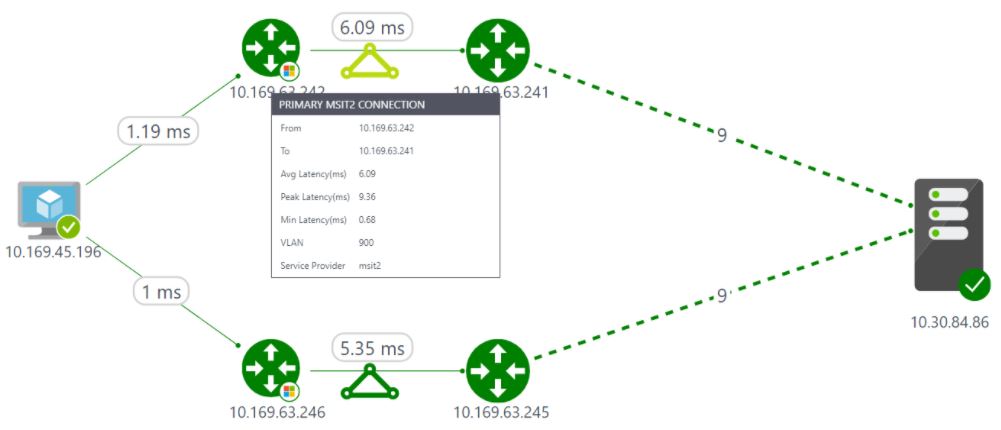
It lets you view the bandwidth utilization trends. Not only can you view the aggregated bandwidth utilization for all the private peering connections of the ExpressRoute circuit, but you can also drill-down to understand the bandwidth utilization trend for each VNET. This will help you identify the VNETs that are consuming most of your circuit bandwidth. You can also setup alerts to notify when the bandwidth consumed by a VNET crosses the threshold.
NPM also helps you diagnose several circuit connectivity issues.
You can also create custom queries and views. All data that is exposed graphically through NPM’s UI are also available natively in Log Analytics search. You can perform interactive analysis of data in the repository, correlate data from different sources, create custom alerts and views, and export the data to Excel, PowerBI, or a shareable link.
For more information on NPM for ExpressRoute & how to set it up, please refer the below articles:
https://azure.microsoft.com/en-in/blog/expressroute-monitoring-with-network-performance-monitor-npm-is-now-generally-available/
https://video2.skills-academy.com/en-us/azure/azure-monitor/insights/network-performance-monitor
https://video2.skills-academy.com/en-us/azure/azure-monitor/insights/network-performance-monitor-expressroute
https://video2.skills-academy.com/en-us/azure/expressroute/how-to-npm
Kindly let us know if the above helps or you need further assistance on this issue.
----------------------------------------------------------------------------------------------------------------
Please "Accept the answer" if the information helped you. This will help us and others in the community as well.
This info helped greatly, thank you!