How can I analyze the logs coming from AKS and reduce them?

Najam ul Saqib 280 Reputation points
2024-09-04T08:02:02.1666667+00:00

I have recently added a data connector for AKS to my Sentinel workspace and it has caused a major hike in the amount of logs ingested in the workspace (which eventually increases the costs as well)

I want to know:

  1. How can I check which tables are ingesting logs from AKS?
  2. How can I check what type of data is coming in from AKS
  3. Can I somehow configure the type and size of logs coming in from AKS?
Azure Kubernetes Service (AKS)
An Azure service that provides serverless Kubernetes, an integrated continuous integration and continuous delivery experience, and enterprise-grade security and governance.
2,073 questions
Microsoft Sentinel
Microsoft Sentinel
A scalable, cloud-native solution for security information event management and security orchestration automated response. Previously known as Azure Sentinel.
1,123 questions
{count} votes

2 answers

Sort by: Most helpful
  1. Clive Watson 6,351 Reputation points MVP
    2024-09-04T09:05:57.49+00:00

    Hello, this is to answer Q1, which will help us answer Q2 & Q3, you can use a query such as this, or one of the workbooks like "Workspace Usage". Adjust query of you need more than 30days of data.

    Usage
    | make-series Gbytes=sum(Quantity)/1000 default=0 on TimeGenerated from ago(30d) to now() step 1d by DataType
    | render columnchart 
    

    Then from the chart you should see on and after the date you enabled AKS which Table grew in size (the bar size will be larger). Example output for AzureDiagnostics, my data is pretty stable, but your looking for a a bar to be growing or a brand new Table.

    User's image


  2. Clive Watson 6,351 Reputation points MVP
    2024-09-12T15:59:30.46+00:00

    Sorry for the delayed, reply, that connector https://github.com/Azure/Azure-Sentinel/tree/master/Solutions/Azure%20kubernetes%20Service shows that the data is located in AzureDiagnostics and the category that the two hunting queries use is kube-audit

    e.g.

    AzureDiagnostics

    | where Category == "kube-audit"

    So if you adjust my query for that:
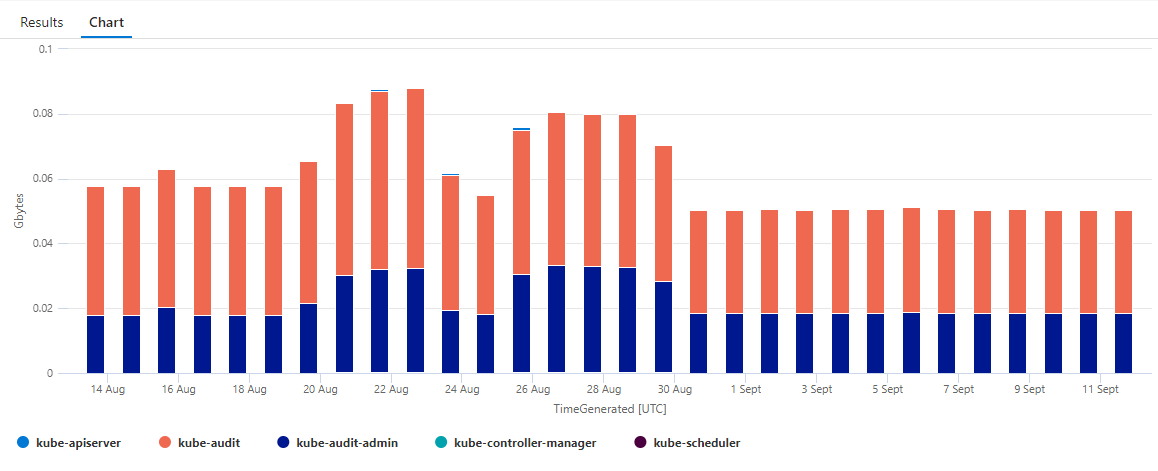
    AzureDiagnostics
    | where Category startswith "kube"
    | make-series Gbytes=sum(_BilledSize)/(1024*1024*1024) default=0 on TimeGenerated from ago(30d) to now() step 1d by Category, ResourceProvider
    | render columnchart 
    

    You will be able to see that Category and others (amend line 2 if you dont, to be "kube-audit"), or remove the line if you want to see all data categories.

    User's image

    You can then further refine by pod or container id?

     AzureDiagnostics
      | where Category == "kube-audit"
      | summarize Gbytes=sum(_BilledSize)/(1024*1024*1024) by containerID_s //, pod_s
    

Your answer

Answers can be marked as Accepted Answers by the question author, which helps users to know the answer solved the author's problem.