Azure Disk Storage
A high-performance, durable block storage designed to be used with Azure Virtual Machines and Azure VMware Solution.
590 questions
This browser is no longer supported.
Upgrade to Microsoft Edge to take advantage of the latest features, security updates, and technical support.

It is unclear why you are allowed to chose a P50 performance tier for a P40 disk when the published specs for a P40 are identical to a P50 per the following article:
https://video2.skills-academy.com/en-us/azure/virtual-machines/disks-types#disk-size-1
What is the benefit of choosing the higher tier when the published specs indicate that there should be no change in performance?
Redirected from GitHub Issue.

@vipullag-MSFT Thanks for raising this question! You can correct that as P40 and P50 performance are identical, there are no current benefits for customers to up tier today. However, we don’t want to block the tier upgrade functionality as we can potentially increase our performance target on larger disk sizes.
Let me provide more information on the performance between P40 and P50.
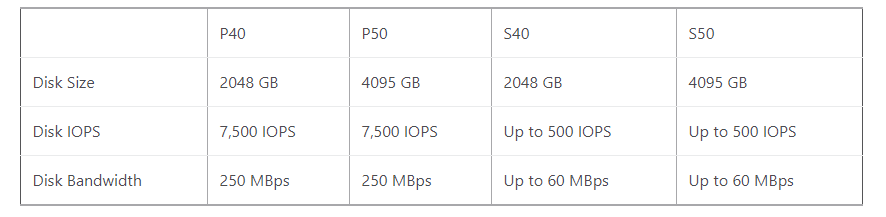
To provide flexibility for customers to provision an appropriate disk size which matches their workloads, we introduce two disk sizes in P40 (2TB) and P50 (4TB) for both Managed and unmanaged Premium Disks; S40 (2TB) and S50 (4TB) for Standard Managed Disks. Customers can also provision the maximum disk size of 4,095 GB for Standard unmanaged disks.
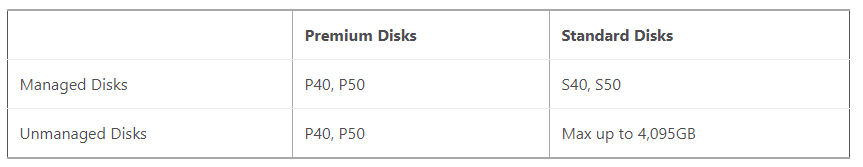
Larger Premium Disks P40 and P50 will support your IO intensive workload, consequently, offers higher provisioned disk performance. The maximum Premium Disk IOPS and bandwidth is increased to 7,500 IOPS and 250 MBps respectively. Standard Disks, of all sizes, will offer up to 500 IOPS and 60 MBps.
The maximum IOPS limits per VM and per disk are different and independent of each other. Make sure that the application is driving IOPS within the limits of the VM as well as the premium disks attached to it. In other words, VM throughput limit supersedes the aggregated Disks throughput limit. Otherwise, the application performance will experience throttling. For example, a P50 disk provisions 250 MB per second disk throughput. Each high scale VM size also has a specific throughput limit that it can sustain. For example, Standard GS5 VM has a maximum throughput of 2,000 MB per second. If you attach 10 x P50 disk to GS5 VM, you will get throttled at 2,000 MB sec.
“When you attach a premium storage disk to your high scale VM, Azure provisions for you a guaranteed number of IOPS as per the disk specification. For example, a P50 disk provisions 7500 IOPS. Each high scale VM size also has a specific IOPS limit that it can sustain. For example, a Standard GS5 VM has 80,000 IOPS limit.”
Metrics that help diagnose disk IO capping:
Metrics that help diagnose VM IO capping:
You can also find new documentation explaining how VM + Disk +Caching can affect applications performance:
https://video2.skills-academy.com/en-us/azure/virtual-machines/linux/disk-performance-linux
Hope this helps!
Kindly let us know if the above helps or you need further assistance on this issue.
----------------------------------------------------------------------------------------------------------------------------------------------------
Please don’t forget to "Accept the answer” and “up-vote” wherever the information provided helps you, this can be beneficial to other community members.