VB
An object-oriented programming language developed by Microsoft that is implemented on the .NET Framework. Previously known as Visual Basic .NET.
2,710 questions
This browser is no longer supported.
Upgrade to Microsoft Edge to take advantage of the latest features, security updates, and technical support.
' cx='32' cy='32' r='32' /%3E%3Ctext x='50%25' y='55%25' dominant-baseline='middle' text-anchor='middle' fill='%23FFF' %3EJS%3C/text%3E%3C/svg%3E)
Hi!
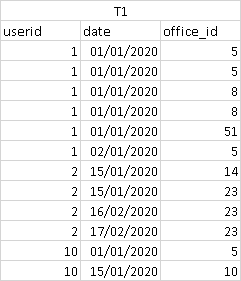
I have the starting table T1 in access 2013 with this data
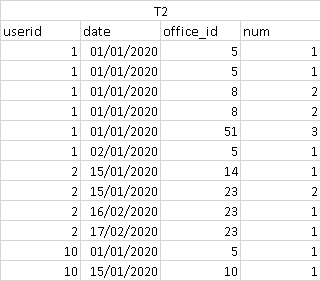
I need a visual code to create a new table with the field num where it indicates the number of different centers in which the user is on the same day. The output table should be T2
Thanks in advance
' cx='32' cy='32' r='32' /%3E%3Ctext x='50%25' y='55%25' dominant-baseline='middle' text-anchor='middle' fill='%23FFF' %3EAK%3C/text%3E%3C/svg%3E)
First, what a marvelous little problem!!!
So for the readers, lets get the question clear:
The poster wants a rank (count) of each user for a day.
So, user “5” might visit 1 or 20 times in one day, but he is the FIRST – gets “1”
User “8” might visit 1 or 20 times in one day, but he is the Second user – gets “2”
User “51” might visit 1 or 20 times in one day, but he is the Third user for that day – gets “3”.
So this is HOW we come up with "51" = 3 - he is the 3rd user/visitor for that day
Ok, now with the above problem?
Well, MS-Access sql does not have the ability to return a row_id in a query (ie:1, then 2, then 3).
And worse, we do NOT have “rank”
This is rare problem in which both of these features would and could be valuable here.
But, you can still do this without a temp table.
So, save a access query like this:
SELECT 1 AS tt, Z.User_ID, Z.Date, Z.Office_id
FROM Table1 AS Z
GROUP BY Z.User_ID, Z.Date, Z.Office_id;
I called the above “td”
Then we can solve this by doing:
SELECT Table1.User_id, Table1.Date, Table1.Office_id, (SELECT SUM(tt) FROM td
WHERE td.[Date] = Table1.Date AND td.Office_id <= Table1.Office_id and td.User_id = Table1.User_ID) AS num
FROM Table1;
And you get this output:
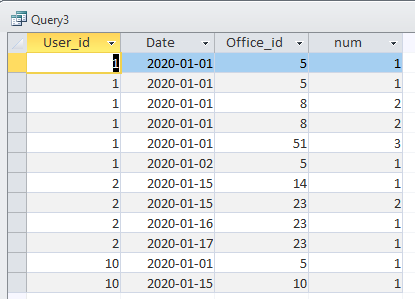
Note that the "cute" <= is a trick in access to get a "rank" which of course we have in sql server, but not in Access.
No matter how you slice this? This is a fantastic SQL question for a “test”. It simple, not a lot of columns, and no joins either!!!
Regards,
Albert D. Kallal (Access MVP 2003-2017)
Edmonton, Alberta Canada
Hi!
Thanks for your reply and for your time.
Your answer is almost perfect but it did not completely solve the question since in your output table the userid field is missing.
For example, on 2020-01-15, in your answer for the field office_id = 23, the field num = 3. It is not correct since userid 2 that day connects in 2 offices. first in 14 (so the num field = 1) and second in 23 (num field = 2).
Regards
Ah, ok - my bad - the same approach will work with the extra column. I'll edit the post - 2 minutes.
R
Albert
As a follow up - do look at my changes to my solution - I have included the user_id column, and you can see the same posted solution works just fine.
R
Albert
Hi AlbertKallal
It works perfectly Thanks for your time and share your knowledge.
Regards
' cx='32' cy='32' r='32' /%3E%3Ctext x='50%25' y='55%25' dominant-baseline='middle' text-anchor='middle' fill='%23FFF' %3EA%3C/text%3E%3C/svg%3E)
Hi
You do not explain what you want in enough detail.
What / where is 'field t'?
What constitutes the 'different centers' - something to do with the offices?
In your T2 table, please explain how the 'num' value of 3 is derived for office_id 51?
Hi!
Thaks for your reply.
Answering your questions
What / where is 'field t'?I changed the fied name to "num"
What constitutes the 'different centers' - something to do with the offices?I mean to say the number of offices in which the user connects that day. For example, userid 1 in 01/01/2020 was connected in 3 offices. First officie_id 5. (num field value1. the other times it connects in the same office are considered the same) second that day he connected in office 8 (num field value 2) and thrid in office 51 (num field value 3). January 2 he connected in just one office (office 5). num field value 1
In your T2 table, please explain how the 'num' value of 3 is derived for office_id 51? office_id 51 is the thrid office in which he connects in juanuary 1
Thanks for help and for your time
Regards
' cx='32' cy='32' r='32' /%3E%3Ctext x='50%25' y='55%25' dominant-baseline='middle' text-anchor='middle' fill='%23FFF' %3EXZ%3C/text%3E%3C/svg%3E)
Hi @jm saf ,
Basically, you need to create a new table 'T2'.
Then use the following sql statement to copy T1's data to T2.
INSERT INTO T2 SELECT * FROM T1
Finally, create a new column 'num' in the existing table and add some data in it.
Hope it could be helpful.
Besides, if you need further assistance, please provide more details about your 'num' column.
Best Regards,
Xingyu Zhao
*
If the answer is helpful, please click "Accept Answer" and upvote it.
Note: Please follow the steps in our documentation to enable e-mail notifications if you want to receive the related email notification for this thread.
Hi! Xingyu!
Please see the explanation I have given to LesHay. I hope it clarifies the problem for you
Thanks for your interest in helping me.
Regards

It seems that you need an SQL query like this:
select *,
    dense_rank() over (partition by userid, [date] order by [date], office_id) as num
from T1
Then insert results to T2. Do you want to find an equivalent query for Access or to calculate num in VB or VBA?
HI Viorel-1!
Thanks for your reply
As you say. I need a VB routine to calculate num field in a new table.
Please see the explanation I have given to LesHay.
I hope I have explained myself better.
Thanks in advance!
Regards
Do you already have a VB code that loads the data from database (into DataTable object, for example)? Then it is possible to build a new DataTable that includes num values.
Yes but my problem is the code to calculate the value of the num field
Since you already have the code that deals with DataTable objects, then check this example and adjust it for your needs:
Dim T1 As New DataTable
T1.Columns.Add("userid", GetType(Integer))
T1.Columns.Add("date", GetType(DateTime))
T1.Columns.Add("office_id", GetType(Integer))

Dim T2 As New DataTable
T2.Columns.Add("userid", GetType(Integer))
T2.Columns.Add("date", GetType(DateTime))
T2.Columns.Add("office_id", GetType(Integer))
T2.Columns.Add("num", GetType(Integer))

T1.Rows.Add(1, "01/01/2020", 5)
T1.Rows.Add(1, "01/01/2020", 5)
T1.Rows.Add(1, "01/01/2020", 8)
T1.Rows.Add(1, "01/01/2020", 8)
T1.Rows.Add(1, "01/01/2020", 51)
T1.Rows.Add(1, "02/01/2020", 5)
T1.Rows.Add(2, "15/01/2020", 14)
T1.Rows.Add(2, "15/01/2020", 23)
T1.Rows.Add(2, "16/02/2020", 23)
T1.Rows.Add(2, "17/02/2020", 23)
T1.Rows.Add(10, "01/01/2020", 5)
T1.Rows.Add(10, "15/01/2020", 10)

Dim q1 = T1.AsEnumerable _
    .Select(Function(r) New With {.userid = r.Field(Of Integer)("userid"), .date = r.Field(Of DateTime)("date"), .office_id = r.Field(Of Integer)("office_id")})

Dim q2 = q1 _
    .GroupBy(Function(d) New With {Key d.userid, Key d.date}) _
    .Select(Function(g) New With {g.Key, .Values = g.Select(Function(v) v.office_id).Distinct.OrderBy(Function(o) o).Select(Function(o, i) New With {.office_id = o, .num = i + 1})}) _
    .SelectMany(Function(d) d.Values.Select(Function(v) New With {d.Key.userid, d.Key.date, v.office_id, v.num}))

Dim q3 = q1 _
    .Join(q2, Function(a) New With {Key a.userid, Key a.date, Key a.office_id}, Function(b) New With {Key b.userid, Key b.date, Key b.office_id}, Function(a, b) New With {a.userid, a.date, a.office_id, b.num})

For Each r In q3
    T2.Rows.Add(r.userid, r.date, r.office_id, r.num)
Next
thanks for your interest in helping me
That's a good option buti n this case I must implement the project in access 2013
Regards
Then it should be specified a more appropriate Tag for this question, if any.
Hi Viorel!
You're right but I wasn`t able to find a more specific one.
really appreciate your help and the time you have dedicated to solve my question.
Regards