Why do the data labels not show in this chart?

David Thielen 61 Reputation points
2021-02-22T22:02:47.62+00:00

Hi all;

Please take a look at the file ATE-4760.docx. Why do data labels not appear for the red & green lines? If you look inside the chart1.xml, in the <c:dLbls> part it has:

<c:showVal val="1"/>

So why does it not show? And for my use, I don't need to know how to make it show, I need to know why in this case it does not show as I need to duplicate that behavior.

thanks - dave

Office Open Specifications
Office: A suite of Microsoft productivity software that supports common business tasks, including word processing, email, presentations, and data management and analysis.Open Specifications: Technical documents for protocols, computer languages, standards support, and data portability. The goal with Open Specifications is to help developers open new opportunities to interoperate with Windows, SQL, Office, and SharePoint.
138 questions
{count} votes

Accepted answer
  1. Tom Jebo 1,996 Reputation points Microsoft Employee
    2021-02-24T00:17:43.207+00:00

    Dave,

    So in your chart1.xml, you actually only have two labels defined, "Approved" and "Available". When I ask Microsoft Word's UI to "show the labels for the data points", it actually has to add all the individual data point labels like this:

                <c:dLbl>  
                  <c:idx val="1"/>  
                  <c:delete val="1"/>  
                  <c:extLst>  
                    <c:ext xmlns:c15="http://schemas.microsoft.com/office/drawing/2012/chart" uri="{CE6537A1-D6FC-4f65-9D91-7224C49458BB}"/>  
                    <c:ext xmlns:c16="http://schemas.microsoft.com/office/drawing/2014/chart" uri="{C3380CC4-5D6E-409C-BE32-E72D297353CC}">  
                      <c16:uniqueId val="{00000004-09EB-4C88-9E2A-9B38D3E6DFC7}"/>  
                    </c:ext>  
                  </c:extLst>  
                </c:dLbl>  
                <c:dLbl>  
                  <c:idx val="2"/>  
                  <c:delete val="1"/>  
                  <c:extLst>  
                    <c:ext xmlns:c15="http://schemas.microsoft.com/office/drawing/2012/chart" uri="{CE6537A1-D6FC-4f65-9D91-7224C49458BB}"/>  
                    <c:ext xmlns:c16="http://schemas.microsoft.com/office/drawing/2014/chart" uri="{C3380CC4-5D6E-409C-BE32-E72D297353CC}">  
                      <c16:uniqueId val="{00000005-09EB-4C88-9E2A-9B38D3E6DFC7}"/>  
                    </c:ext>  
                  </c:extLst>  
                </c:dLbl>  
                <c:dLbl>  
                  <c:idx val="3"/>  
                  <c:delete val="1"/>  
                  <c:extLst>  
                    <c:ext xmlns:c15="http://schemas.microsoft.com/office/drawing/2012/chart" uri="{CE6537A1-D6FC-4f65-9D91-7224C49458BB}"/>  
                    <c:ext xmlns:c16="http://schemas.microsoft.com/office/drawing/2014/chart" uri="{C3380CC4-5D6E-409C-BE32-E72D297353CC}">  
                      <c16:uniqueId val="{00000006-09EB-4C88-9E2A-9B38D3E6DFC7}"/>  
                    </c:ext>  
                  </c:extLst>  
                </c:dLbl>  
    

    ....

    So above you see two of the 9 or 10 data point labels that Word adds. And you check by opening this in Word, selecting the series plot, formatting the data labels in the side bar and first unchecking then checking the "Value" checkbox. That causes Word to have to write out the XML to show all the labels. Like this:
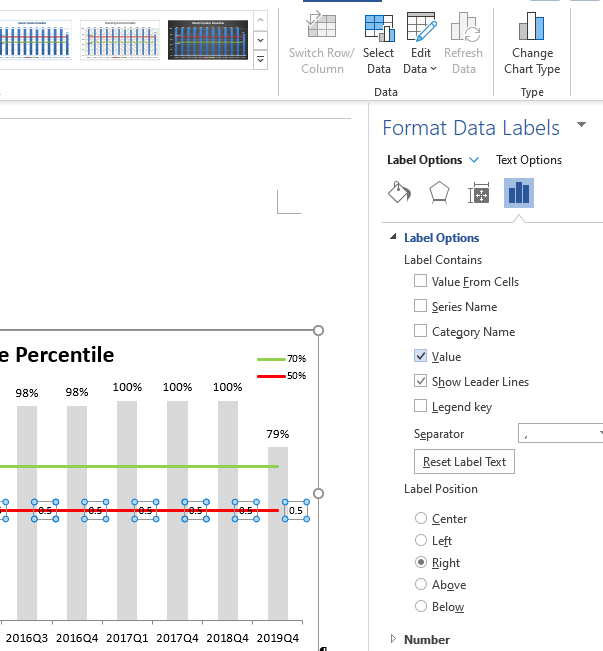
    71302-formatdatalabels.png

    Tom

    P.S. I only posted this as an "Answer" post because I couldn't fit it in a comment. Feel free to respond if this doesn't answer your question.


0 additional answers

Sort by: Most helpful

Your answer

Answers can be marked as Accepted Answers by the question author, which helps users to know the answer solved the author's problem.