Azure Network Watcher
An Azure service that is used to monitor, diagnose, and gain insights into network performance and health.
169 questions
This browser is no longer supported.
Upgrade to Microsoft Edge to take advantage of the latest features, security updates, and technical support.
' cx='32' cy='32' r='32' /%3E%3Ctext x='50%25' y='55%25' dominant-baseline='middle' text-anchor='middle' fill='%23FFF' %3ERS%3C/text%3E%3C/svg%3E)
We ran SSH between 2 VMs and were monitoring the flow logs. All we could see was records like these:
1621126416,10.3.0.4,10.2.0.4,42598,5201,T,I,A,B,,,,
We waited for a long time but did not see any records with C or E values in Flow State flag as those records have the byte counters.
Here's the doc describing v2 flow logs:https://video2.skills-academy.com/en-us/azure/network-watcher/network-watcher-nsg-flow-logging-portal#view-flow-log
And here's the description of the flow state flag from that link:
Captures the state of the flow. Possible states are B: Begin, when a flow is created. Statistics aren't provided. C: Continuing for an ongoing flow. Statistics are provided at 5-minute intervals. E: End, when a flow is terminated. Statistics are provided.
Can you please let us know how can we get flow records with flow state flag as C and E.
Hello, any update on this?

@Rushabh Sanghvi , I did manage to generate E flag using IPERF Cmdlet. iperf -c <IP> should initiate the connection and on termination it should leave an E flag on the log.
' cx='32' cy='32' r='32' /%3E%3Ctext x='50%25' y='55%25' dominant-baseline='middle' text-anchor='middle' fill='%23FFF' %3ESM%3C/text%3E%3C/svg%3E)
@Rushabh Sanghvi Thank you for reaching out to Microsoft Q&A.
I understand that you are unable to see flows with Flow State flags C&E in NSG Flow Logs between 2 VMs in the same VNet. I have setup a lab for a similar setup and generated traffic to look at the NSG Flow Logs for 2 VMs in the same Vnet.
Upon logging some RDP traffic between them, I reviewed the NSG flow logs and can see C: Continuing for an ongoing flow traffic as shown below:
"1626920875,172.24.0.6,172.24.0.8,51871,3389,T,O,A,C,442,33973,608,79804","1626920875,172.24.0.6,172.24.0.8,53630,3389,U,O,A,C,1389,120724,2228,1832252",
As seen from dcumentation, this traffic is logged every 5 mins. However, I understand that you are unable to see these flags. As seen from your flow logs-
1621126416,10.3.0.4,10.2.0.4,42598,5201,T,I,A,B,,,,
The port used here is 5201 which is Iperf traffic. Iperf may be behaving in a way that there may not be any continuing traffic which is why this may not be showing up. Can you test this out using a different port/protocol such as RDP to see if you can get these flags?
Please feel free to let me know if you need any further assistance and we will be glad to help you.
Remember:
Please accept an answer if correct. Original posters help the community find answers faster by identifying the correct answer. Here is how.
Want a reminder to come back and check responses? Here is how to subscribe to a notification.
@SaiKishor-MSFT Thank you for your response. We have linux systems so will not be able to run RDP traffic. Can you suggest some linux command line tool to generate traffic between two VMs that you believe will result in us seeing E flag in the flow?
I will inspect our flow data from other subscription as well to check again if we see E flags in the flow data for some other type of traffic (port/protocol).
@Rushabh Sanghvi I setup another lab with Linux machines and connected from one machine to the other using SSH using below command-
ssh -i <path to private key in pem format> azureuser@<private ip address of remote machine>
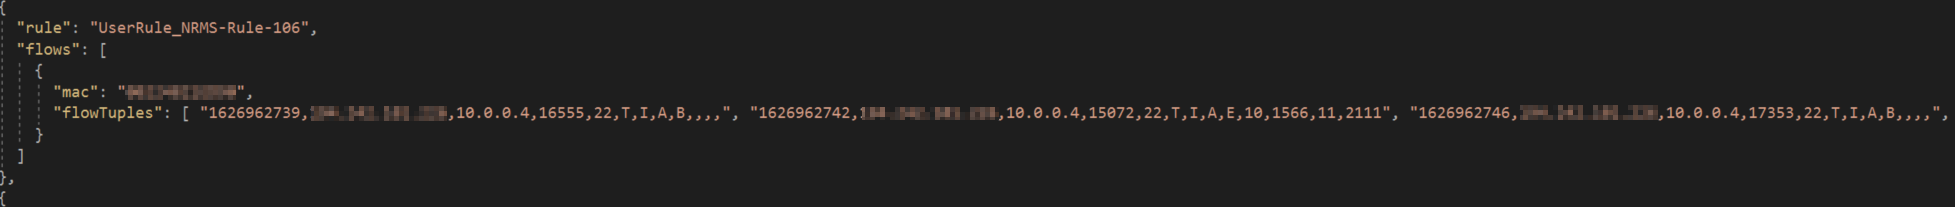
When I did this, following flows were recorded:
azure"1626978047,172.24.0.9,172.24.0.10,54598,22,T,O,A,C,1,74,1,74","1626978053,172.24.0.9,172.24.0.10,54598,22,T,O,A,E,0,0,0,0","1626978093,172.24.0.9,172.24.0.10,54694,22,T,O,A,B,,,,"]}]},
As seen from above, C & E flags have been captured. Please let me know if you can try out the above command on your Linux Machines and see if that generates these flags? Please let me know if you have further questions/concerns. Thank you!