Azure Machine Learning
An Azure machine learning service for building and deploying models.
2,848 questions
This browser is no longer supported.
Upgrade to Microsoft Edge to take advantage of the latest features, security updates, and technical support.
' cx='32' cy='32' r='32' /%3E%3Ctext x='50%25' y='55%25' dominant-baseline='middle' text-anchor='middle' fill='%23FFF' %3EWB%3C/text%3E%3C/svg%3E)
How is the "GpuUtilization" metric computed for an AML workspace? What are the inputs and what is the equation used to compute GpuUtilization?
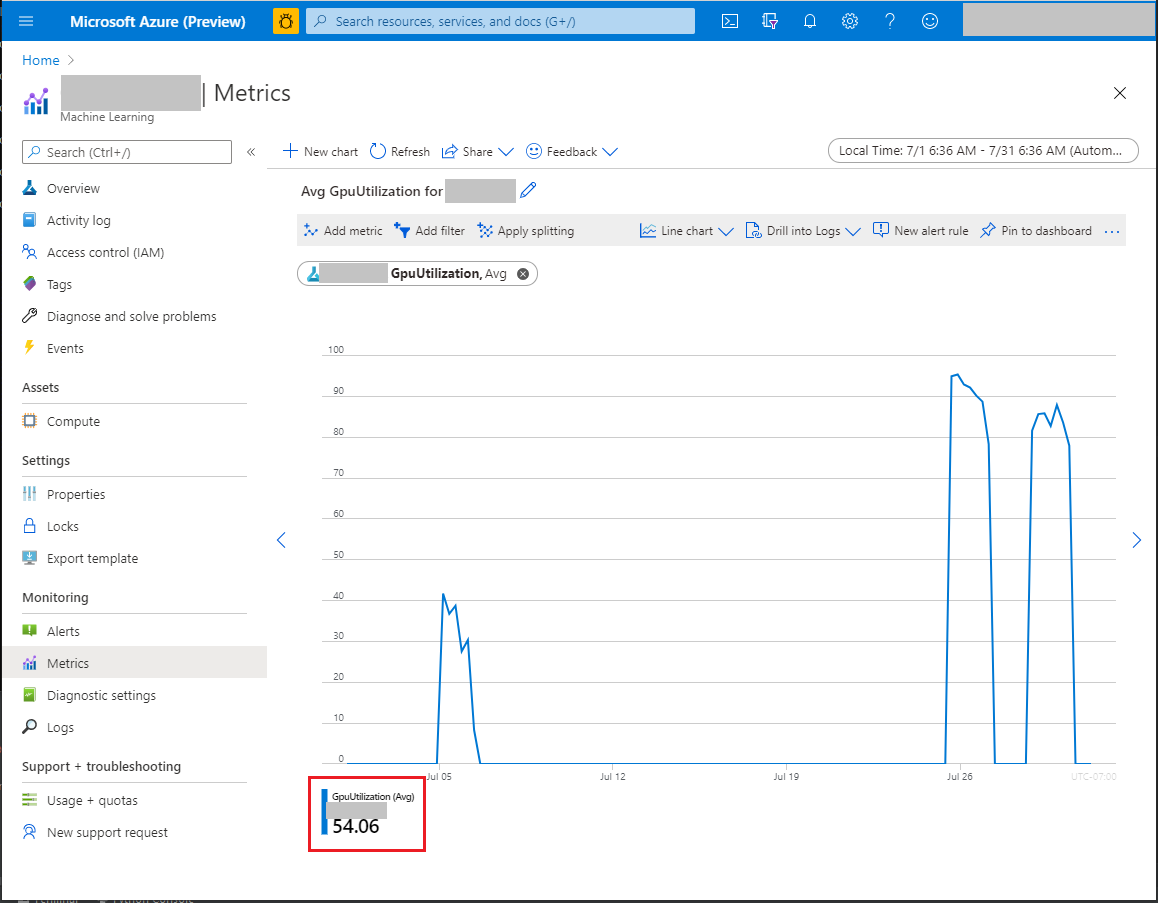
The "metrics" tab in the AML web portal shows a chart of the GpuUtilization over a specified time period, along with the average GpuUtilization for that time period. However, I have found that average GpuUtilization does not appear to accurately reflect the data shown in the chart for some of my organization's AML workspaces.
For example, the following screenshot shows the GpuUtilization for July 1-31, with the average GpuUtilization reported as 54.06. This is clearly much higher than what is shown in the chart. When I download the data from the chart (Share -> Download to Excel), I compute the average GpuUtilization to be ~11% in Excel. Why is there such a discrepancy?
I have found similar discrepancies for other AML workspaces as well. However, the average GpuUtilization appears to be more accurate for the August 1-25 time period than it is for July 1-31. I wish to better understand how AML computes the average GpuUtilization over a time period so we can accurately account for my organization's AML GPU usage on a per-workspace basis.
' cx='32' cy='32' r='32' /%3E%3Ctext x='50%25' y='55%25' dominant-baseline='middle' text-anchor='middle' fill='%23FFF' %3EGM%3C/text%3E%3C/svg%3E)
Hi, thanks for reaching out. GpuUtilization shows how much percentage of GPU was utilized for a given node during a run/job. One node can have one or more GPUs. This metric is published per GPU per node. You can apply filters based on node to understand the computation better. Let me know if that helps or if you need further assistance. Thanks.
Thanks for your reply and including the link to the metrics descriptions. However, I am still confused. The chart I attached clearly shows a very low GPU utilization. However, the average GPU utilization is reported as 54.06 during this time period, which seems much too high. How can this be?
When I download the data for the chart and compute the average GPU utilization in Excel, it is only ~11, which is much smaller than the 54.06 reported by Azure Monitoring.
I see the same, obvious inconsistency between the chart and the average utilization for many other workspaces as well.
Hello, can you please share the excel output, your subscription id, and workspace id (send it to AzCommunity[at]microsoft[dot]com)? Include title and link to this thread. Let me know here once you've sent the email. We will review it and get back to you shortly. Thanks.
Also, can you ensure that you are excluding rows with zero percentage values in your calculation? I'm still waiting on the above request. Thanks.