Windows Performance Toolkit
A collection of Microsoft performance monitoring tools that produce in-depth performance profiles of Windows operating systems and applications.
97 questions
This browser is no longer supported.
Upgrade to Microsoft Edge to take advantage of the latest features, security updates, and technical support.
' cx='32' cy='32' r='32' /%3E%3Ctext x='50%25' y='55%25' dominant-baseline='middle' text-anchor='middle' fill='%23FFF' %3EAK%3C/text%3E%3C/svg%3E)
I have enabled some PMCs with WPR according to the XSD Schema
    <HardwareCounter Base = "" Id="HarderCounter_PMC" >
        <MicroArchitecturalConfigId Value="test" >
            <ProfileSources Architecture="INTEL" Family="6" Model="78" Stepping="3" Description="Intel(R) Core(TM) i5-6300U CPU @ 2.40GHz" >
                <ProfileSource Name="test" Event="19"    />
            </ProfileSources>
        </MicroArchitecturalConfigId>


        <Events>
            <Event Value="PmcInterrupt" />
        </Events>
        <SampledCounters>
            <SampledCounter Value="TimerFixed" Interval="1221"/>
        </SampledCounters>
        <LastBranch>
            <Events>
                <Event Value="PmcInterrupt" />
            </Events>
            <LastBranchFilters>
                <LastBranchFilterOut Value="FarBranches" />
            </LastBranchFilters>
        </LastBranch>
        <ProcessorTrace>
            <BufferSize Value="8" />
            <CodeMode Value="UserKernel" />
            <Events>
                <Event Value="PmcInterrupt" />
            </Events>
        </ProcessorTrace>
    </HardwareCounter>
I am not sure why I can "attach" a stack event for ProcessorTrace, LastBranch and a top level Events. What does the LastBranch and ProcessTrace node allow me to see? Or is this data which is not exposed in the WPA UI and one would need post process the traces?
I have tried to create a working MicroArchitecturalConfigId but so far I have failed. It looks like one can enable directly processor specific PMCs, but I am not sure.
The WPA view (PMC Rollover) is also not entirely clear to me. When I have the stack trace from the PMCInterrupt why can I not see the function name, unless I add the <Event> node with PMCInterrupt?
With TraceProcessing I can parse the LastBranch data which seems to be useful for linkers to emit hot/cold code paths. For "normal" people this seems to be less useful.
So far I have a rough understanding of LastBranch and the usual events. What is still mysterious to me are the ProcessorTrace events which seem to serve also a specific purpose.

Hello Alois,
ProcessorTracing is more than just previous instruction pointers and can be much bigger than 32 items; the BufferSize="8" element in your example means that an 8 kilobyte buffer is used (and will be included in the ProcessorTrace event data). The data can includes PEBS data (in BBP/BIP/BEP packets), but also much more (Chapter 35 mentions: Paging Information, Time-Stamp Counter, Core Bus Ratio, Taken Not-Taken, MWAIT, Power State, ...).
The current buffer contents are made available as a ProcessorTrace event whenever one of the "events" in the "Events" element occurs.
Is CPI rate (presumably Clockticks Per Instruction) not just the ratio of UnhaltedCoreCycles to InstructionRetired? Adding those counters as "extended data" to CSwitch events should allow the value to be calculated per thread, I would have thought...
Gary
Hello Alois,
My main use of ETW is troubleshooting behavioural rather than performance problems; I normally look at the sequence of individual events to try to understand the behaviour of a system rather than aggregated data (aggregated data seems to be the forte of WPA). I mostly use software that I developed myself rather than libraries like ".NET TraceProcessing". I only occasionally use WPA.
I mention the above to partially explain why I have difficulties in understanding parts of your question.
What do you mean by "attach a stack event for ProcessorTrace"? How are you attaching a "stack" event to ProcessorTrace?
What do you mean by "LastBranch and ProcessTrace node allow me to see"? You mention later on that you roughly understand the LastBranch data (32 Branch Trace Records, see Figure 17-9 in "Intel 64 and IA-32 Architectures, Software Developer’s Manual, Volume 3 (3A, 3B, 3C & 3D): System Programming Guide")
The ProcessorTrace data is just recent data from the "Intel Processor Trace" (IPT) mechanism (see Chapter 35 of "Intel 64 and IA-32 Architectures, Software Developer’s Manual, Volume 3 (3A, 3B, 3C & 3D): System Programming Guide").
Amongst the child elements of HardwareCounter are the elements ""Counters", "Events" and "SampledCounters".
SampledCounters just depends on the presence of the SystemProvider "PmcProfile" keyword; when the counter interval is reached, a PmcInterrupt event is generated.
Counters and Events work together and just depend on the SystemProvider keywords that enable the events being present; when one of the events occurs, the values of the counters are read and attached to the event as "extended data".
I am happy to discuss this further - getting the most out of ETW/WPR/WPA is an interest of mine...
Grüsse aus Basel
Gary
With attaching I mean that I can add an Events node to the ProcessorTrace node
         <ProcessorTrace>
             <BufferSize Value="8" />
             <CodeMode Value="UserKernel" />
             <Events>
                 <Event Value="PmcInterrupt" />
             </Events>
Since Processor Tracing is as far as I was able to read another CPU feature where each ProcessorTrace can have up to 32 previous Instruction pointers stored which can resemble to a short stacktrace.
Similar you can do it for the LastBranch node. I am "just" reverse engineering from the wpr Schema what is possible to configure. Now that I have found most what is possible, the next question is to understand what data you get, and for what it can be useful.
From the Intel Manual it looks like the ProcessorTrace feature can be used to stuff data of the PEBS (Processor Event Based Sampling) to these buffers which are (I assume) written when a specific event which is configurable in ETW e.g. CSWITCH or PmcInterrupt written out.
19.5.5.2 PEBS output to Intel® Processor Trace
Intel Atom processors based on the Tremont microarchitecture introduce the following Precise Event-Based
Sampling (PEBS) extensions:
• A mechanism to direct PEBS output into the Intel® Processor Trace (Intel® PT) output stream. In this scenario,
the PEBS record is written in packetized form, in order to co-exist with other Intel PT trace data.
• New Performance Monitoring counter reload MSRs, which are used by PEBS in place of the counter reload
values stored in the DS Management area when PEBS output is directed into the Intel PT output stream.
When I enable CPU sampling I can record only 3 PMC counters because the timer is needed for CPU sampling. It can therefore be useful to attach the data to context switch events to get a more coarse grained resolution but you can then record 4 counters at once.
I am still searching what I need to enable one of the most central metric CPI Rate to judge how well some code is doing.
Improving things with ETW is also a hobby of mine. Although you are after specific bad ETW events I have found aggregates very useful. You have probably already found https://github.com/Siemens-Healthineers/ETWAnalyzer which is one of my pet projects.
Greetings from Forchheim (Bavaria),
Alois
Ahh thanks that makes much more sense. I am still starting to explore PMCs so sorry for my beginner questions.
Since CPI makes only sense per Core I would expect the counter values to fire at per core level in a uniform way.
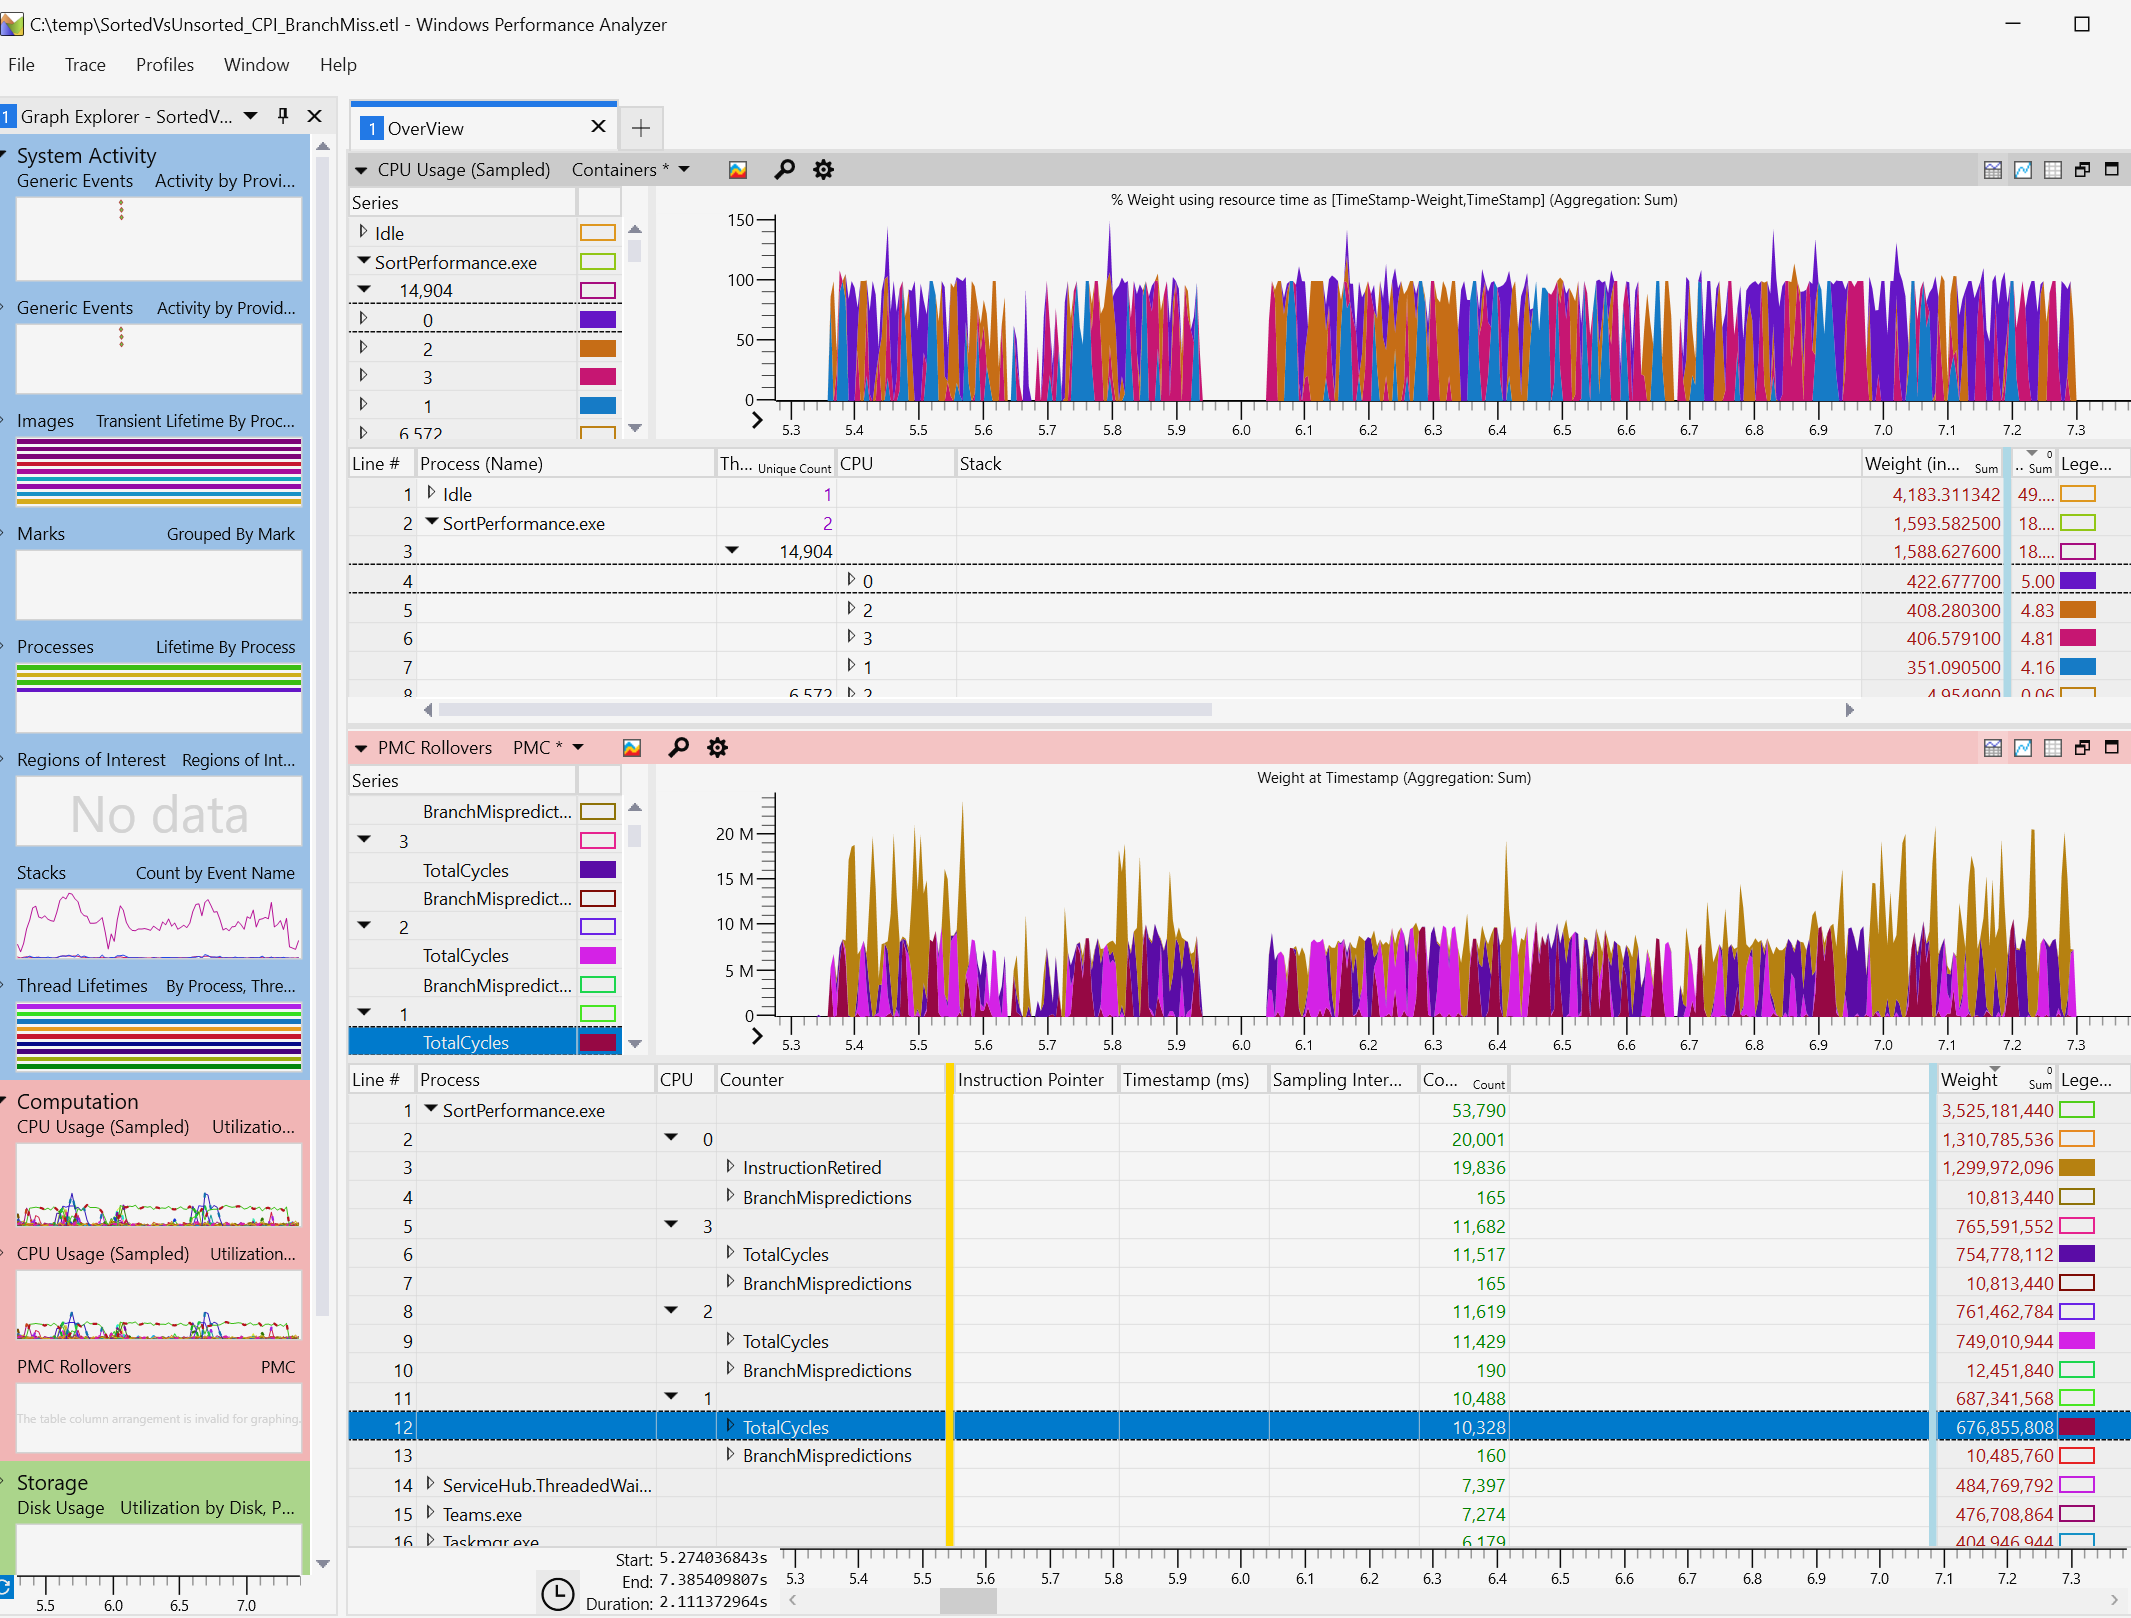
But for some reason the most busy core 0 has InstructionsRetired, but not a single TotalCycles event for that core. That makes no sense, at least in the way
WPA visualizes the data. xperf -i xxx.etl -a pmc shows similar garbage data
   PmcInterrupt,    7562848,   3, SortPerformance.exe (1352), System.Private.CoreLib.dll!Unknown,   TotalCycles,         0
   PmcInterrupt,    7562880,   3, SortPerformance.exe (1352), System.Private.CoreLib.dll!Unknown,   TotalCycles,         0
   PmcInterrupt,    7562909,   3, SortPerformance.exe (1352), System.Private.CoreLib.dll!Unknown,   TotalCycles,         0
   PmcInterrupt,    7562937,   3, SortPerformance.exe (1352), System.Private.CoreLib.dll!Unknown,   TotalCycles,         0
   PmcInterrupt,    7562966,   3, SortPerformance.exe (1352), System.Private.CoreLib.dll!Unknown,   TotalCycles,         0
This seems to be a longer journey. I had hoped that I could get something useful which can nicely be visualized with WPA.
At least my Counters profile is getting annotations
<SampledCounters>
<!-- Accordig to https://stackoverflow.com/questions/53840322/difference-between-llcmisses-and-cachemisses-on-hardware-counters the counters are first
defined in a generic way, which have then Processor Architecture specific latter synonyms.
wpr -pmcsources
Id Name Interval Min Max
0 Timer 10000 1221 1000000
2 TotalIssues == InstructionRetired 65536 4096 2147483647
6 BranchInstructions == BranchInstructionRetired 65536 4096 2147483647
10 CacheMisses == LLCMisses 65536 4096 2147483647
11 BranchMispredictions == BranchMispredictsRetired 65536 4096 2147483647
19 TotalCycles == UnhaltedCoreCycles 65536 4096 2147483647
*25 UnhaltedCoreCycles 65536 4096 2147483647
26 InstructionRetired 65536 4096 2147483647
27 UnhaltedReferenceCycles 65536 4096 2147483647
28 LLCReference 65536 4096 2147483647
*29 LLCMisses 65536 4096 2147483647
*30 BranchInstructionRetired 65536 4096 2147483647
*31 BranchMispredictsRetired 65536 4096 2147483647
32 LbrInserts (LastBranchRecord) 65536 4096 2147483647
33 InstructionsRetiredFixed 65536 4096 2147483647
34 UnhaltedCoreCyclesFixed 65536 4096 2147483647
35 UnhaltedReferenceCyclesFixed 65536 4096 2147483647
36 TimerFixed 10000 1221 1000000
-->
<SampledCounter Value="TotalCycles" Interval="65536"/>
<SampledCounter Value="InstructionRetired" Interval="65536"/>
<SampledCounter Value="BranchMispredictions" Interval="65536"/>
</SampledCounters>
I start to understand things a bit better. It would be perfect if we could arrange a chat. My Mail is
Alois DOT Kraus at Siemens-Healthineers.com
Replace DOT with .