What’s new for SQL Server vNext on Windows CTP 1.1 for Analysis Services
The public CTP 1.1 of SQL Server vNext on Windows is available here! This public preview includes the following enhancements for Analysis Services tabular.
- New infrastructure for data connectivity and ingestion into tabular models with support for TOM APIs and TMSL scripting. This enables:
- Support for additional data sources, such as MySQL. Additional data sources are planned in upcoming CTPs.
- Data transformation and data mashup capabilities.
- Support for BI tools such as Microsoft Excel enable drill-down to detailed data from an aggregated report. For example, when end-users view total sales for a region and month, they can view the associated order details.
- Enhanced support for ragged hierarchies such as organizational charts and chart of accounts.
- Enhanced security for tabular models, including the ability to set permissions to help secure individual tables.
- DAX enhancements to make DAX more accessible and powerful. These include the IN operator and table/row constructors.
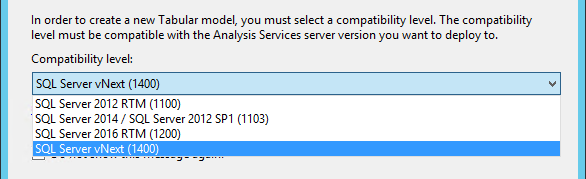
New 1400 Compatibility Level
SQL Server vNext CTP 1.1. for Analysis Services introduces the 1400 compatibility level for tabular models. To benefit from the new features for models at the 1400 compatibility level, you’ll need to download and install the December release of SSDT for CTP 1.1. In SSDT, you can select the new 1400 compatibility level when creating new tabular model projects. Models at the 1400 compatibility level cannot be deployed to SQL Server 2016 or earlier, or downgraded to lower compatibility levels.
Note that this SSDT Tabular release for CTP 1.1 is an early preview for evaluating the vNext capabilities of Analysis Services delivered with the 1400 compatibility level. It is not supported in production environments. Also, only install the Analysis Services, but not the Reporting Services and Integration Services components. Either install on a newly installed computer or VM or uninstall any previous versions first. Also, only work with Tabular 1400 models using this preview version of SSDT. For Multidimensional as well as Tabular 1100, 1103, and 1200 models, use SSDT version 16.5.
New Infrastructure for Data Connectivity
CTP1.1 release introduces a new infrastructure for data connectivity and ingestion into tabular models with support for TOM APIs and TMSL scripting. This is based on similar functionality in Power BI Desktop and Microsoft Excel 2016. There is a lot of information on this topic, so we have created a separate blog post here.
Detail Rows
A much-requested feature for tabular models is the ability to define a custom row set contributing to a measure value. Multidimensional models already achieve this by using the default drillthrough action. This allows end-users to view information in more detail than the aggregated level.
For example, the following PivotTable shows Internet Total Sales by year from the Adventure Works sample tabular model. Users can right-click the cell for 2010 and then select the Show Details menu option to view the detail rows.
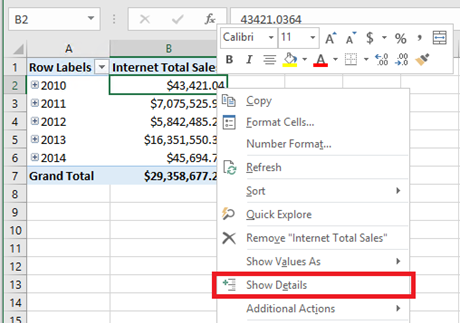
By default, the associated data in the Internet Sales table is displayed. This behavior is often not meaningful to users because the table may not have the necessary columns to show useful information such as customer name and order information.
Detail Rows Expression Property for Measures
CTP1.1 introduces the Detail Rows Expression property for measures. It allows the modeler to customize the columns and rows returned to the end user.
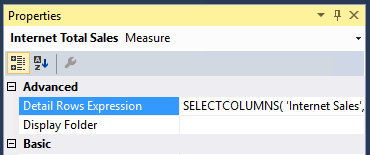
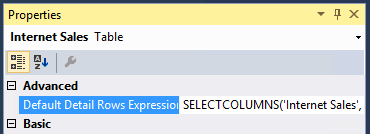
It is anticipated the SELECTCOLUMNS DAX function will be commonly used for the Detail Rows Expression. The following example defines the columns to be returned for rows in the Internet Sales table.
 SELECTCOLUMNS(
    'Internet Sales',
    "Customer First Name", RELATED(Customer[Last Name]),
    "Customer Last Name", RELATED(Customer[First Name]),
    "Order Date", 'Internet Sales'[Order Date],
    "Internet Total Sales", [Internet Total Sales]
)
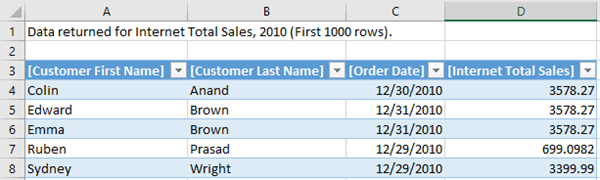
With the property defined and the model deployed, the custom row set is returned when the user selects Show Details. It automatically honors the filter context of the cell that was selected. In this example, only the rows for 2010 value are displayed.
Default Detail Rows Expression Property for Tables
In addition to measures, tables also have a property to define a detail rows expression. The Default Detail Rows Expression property acts as the default for all measures within the table. Measures that do not have their own expression defined will inherit the expression from the table and show the row set defined for the table. This allows reuse of expressions, and new measures added to the table later will automatically inherit the expression.
DETAILROWS DAX Function
The DETAILROWS DAX function has been added in CTP1.1. The following DAX query returns the row set defined by the detail rows expression for the measure or its table. If no expression is defined, the data for the Internet Sales table is returned as it is the table containing the measure.
EVALUATE DETAILROWS([Internet Total Sales])
MDX DRILLTHROUGH statements – without a RETURN clause – are also compatible with detail rows expressions defined in tabular models.
Ragged Hierarchies
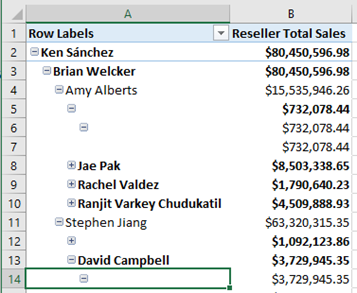
As described in this article, Analysis Services tabular models can be used to model parent-child hierarchies. Hierarchies with a differing number of levels are referred to as ragged hierarchies. An example of a ragged hierarchy is an organizational chart. By default, ragged hierarchies are displayed with blanks for levels below the lowest child. This can look untidy to users, as shown by this organizational chart in Adventure Works:
CTP1.1 introduces the Hide Members property to correct this. Simply set the Hide Members property on the hierarchy to Hide blank members.
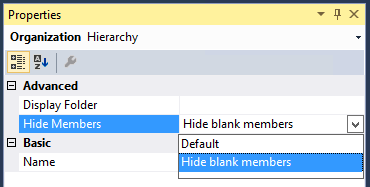
Note: It is necessary that the blank members in the model are represented by a DAX blank value, not an empty string.
With the property set and the model deployed, the more presentable version of the hierarchy is displayed.
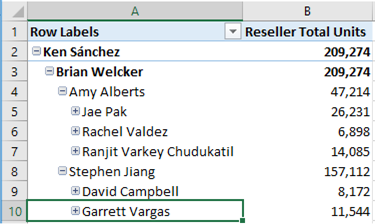
Table-Level Security
Roles in tabular models already support a granular list of permissions, and row-level filters to help protect sensitive data. Further information is available here.
CTP1.1 builds on this by introducing table-level security. In addition to restricting access to the data itself, sensitive table names can be protected. This helps prevent a malicious user from discovering that such a table exists.
The current version requires that a whole table’s metadata, and therefore all its columns, is set to be protected. Additionally, table-level security must be set using the JSON-based metadata, Tabular Model Scripting Language (TMSL), or Tabular Object Model (TOM).
The following snippet of JSON-based metadata from the Model.bim file helps secure the Product table in the Adventure Works sample tabular model by setting the MetadataPermission property of the TablePermission class to None.
 "roles": [
  {
    "name": "Users",
    "description": "All allowed users to query the model",
    "modelPermission": "read",
    "tablePermissions": [
      {
        "name": "Product",
        "metadataPermission": "none"
      }
    ]
  }
DAX Enhancements
CTP1.1 is compatible with the IN operator for DAX expressions. The TSQL IN operator is commonly used to specify multiple values in a WHERE clause. It feels natural to SQL Server database developers.
Prior to CTP1.1, it was common to specify multi-value filters using the logical OR operator or function. Consider the following measure definition.
 Filtered Sales:=CALCULATE(
    [Internet Total Sales],
    'Product'[Color] = "Red"
 || 'Product'[Color] = "Blue"
 || 'Product'[Color] = "Black"
)
This is simplified using the IN operator.
 Filtered Sales:=CALCULATE(
    [Internet Total Sales], 'Product'[Color] IN { "Red", "Blue", "Black" }
)
In this case, the IN operator refers to a single-column table with 3 rows; one for each of the specified colors. Note the table constructor syntax using curly braces.
The IN operator is functionally equivalent to the CONTAINSROW function.
 Filtered Sales:=CALCULATE(
    [Internet Total Sales], CONTAINSROW({ "Red", "Blue", "Black" }, 'Product'[Color])
)
We hope you will agree the IN operator used with table constructors is a great enhancement to the DAX language. MDX veterans should be jumping out of their seats with excitement at this point. The curly braces syntax should also feel natural to programmers of C based languages like C#, and Excel practitioners who use arrays. But wait, there’s more …
Consider the following measure to filter by combinations of product color and category.
 Filtered Sales:=CALCULATE(
    [Internet Total Sales],
    FILTER( ALL( Product[Color], Product[Product Category name] ),
        ( 'Product'[Color] = "Red"   && Product[Product Category Name] = "Accessories" )
     || ( 'Product'[Color] = "Blue"  && Product[Product Category Name] = "Bikes" )
     || ( 'Product'[Color] = "Black" && Product[Product Category Name] = "Clothing" )
    )
)
Wouldn’t it be great if we could use table constructors, coupled with row constructors, to simplify this? In CTP1.1, we can! The above measure is equivalent to the one below.
 Filtered Sales:=CALCULATE(
    [Internet Total Sales],
    FILTER( ALL( Product[Color], Product[Product Category name] ),
        ('Product'[Color], Product[Product Category Name]) IN
        { ( "Red", "Accessories" ), ( "Blue", "Bikes" ), ( "Black", "Clothing" ) }
    )
)
Lastly, it is worth pointing out that table and row constructors are independent of the IN operator. They are simply DAX table expressions. Consider the following DAX query.
 EVALUATE
UNION(
    ROW(
        "Value1", "Red Product Sales",
        "Value2", CALCULATE([Internet Total Sales], 'Product'[Color] = "Red")
    ),
    ROW(
        "Value1", "Blue Product Sales",
        "Value2", CALCULATE([Internet Total Sales], 'Product'[Color] = "Blue")
    ),
    ROW(
        "Value1", "Total",
        "Value2", CALCULATE([Internet Total Sales], 'Product'[Color] IN { "Red", "Blue" })
    )
)
In CTP1.1, it can be more simply expressed like this:
 EVALUATE
{
    ("Red Product Sales",  CALCULATE([Internet Total Sales], 'Product'[Color] = "Red")),
    ("Blue Product Sales", CALCULATE([Internet Total Sales], 'Product'[Color] = "Blue")),
    ("Total",              CALCULATE([Internet Total Sales], 'Product'[Color] IN { "Red", "Blue" }))
}
Download Now!
To get started, download SQL Server vNext on Windows CTP1.1 from here. SSDT for CTP1.1 available here. Be sure to keep an eye on this blog to stay up to date on Analysis Services.
Comments
- Anonymous
December 19, 2016
The comment has been removed- Anonymous
January 12, 2017
I'm assuming you're referring to multidimensional MD (not data mining DM :) ).Nothing in this release, but keep in mind MD is a feature rich mature product, and we have every intention to keep it alive and well for the foreseeable future.
- Anonymous
- Anonymous
December 20, 2016
Does VNext for Tabular model still have cube size restriction such as 2G limit? Does SSAS v.Next have any new feature or improvement for Multidimensional Model?- Anonymous
December 21, 2016
Tabular models aren’t restricted to 2 GB. Typical ranges are in the hundreds of GB, a few larger than a terabyte.The AS team also did a significant improvement for Multidimensional, which we informally call “SuperDax for MD.” It’s just that you can’t see the effects until Power BI is going to take advantage of the new capabilities when connecting to SSAS MD. That’s why we are not talking much about this yet. So this is me not telling you… :-)
- Anonymous
- Anonymous
December 23, 2016
The comment has been removed- Anonymous
January 12, 2017
It removes blank members from the hierarchy (rather than hiding them), but it is not recursive parent child like in MD, no.- Anonymous
March 16, 2017
I have another question related to ragged hierarchies. I've been testing SSAS vNext in an integrated workspace and the "Hide Blank Members" works wonderfully in Excel, but when I connect a Power BI model to my localhost instance, blank members still show in slicers and the like. I know this isn't necessarily your workstream...but do you think you could connect with someone on that team to make sure this is fixed prior to GA roll-out? This feature is exciting for us (and I'm sure many others), but it means very little if our new favorite BI and reporting tool doesn't support it. - Anonymous
March 16, 2017
Additionally...it would be really great if you guys added a button for "Analyze in Power BI" in addition to the current "Analyze in Excel" in SSDT.
- Anonymous
- Anonymous
- Anonymous
December 26, 2016
So, if I have a tabular measure for year-to-date sales, we can now EASILY have a drill through action that displays all detail rows for all days for the current year in context? For example, clicking on YTDSales measure on columns with the year 2010 on rows in Excel will result in the returning of all 2010 sales rows (without having to jump through the ugliest MDX statement concatenation in SSAS history)?- Anonymous
January 12, 2017
Yes, say goodbye to the ugly statement concatenation!
- Anonymous
- Anonymous
December 28, 2016
Will be these features be available for sql server on windows,?- Anonymous
January 12, 2017
They will be available for SQL Server vNext Analysis Services on Windows, yes
- Anonymous
- Anonymous
January 11, 2017
The comment has been removed- Anonymous
January 12, 2017
Yes, filter context will be applied automatically based on the cell/query that activated the action. No string construction for injection of filter values!
- Anonymous
- Anonymous
January 19, 2017
Have been working with vNext CTP 1.1 on Ubuntu and running into issues with SSMS(13.0.16100.1) and VS2015(14.0.25123.00U2). Each are giving problems when accessing tables. SSMS issue: cannot design-not supported (and other niggles). VS2015 issue: "An incompatible SQL Server version was detected." when trying to do just about anything from Server Explorer.(DBeaver seems to be A-OK working with vNext.)Just curious if there was any place to follow-up with the vNext team on these issues... or if you may have any insight.Thanks in advance!- Anonymous
January 19, 2017
Can you ask on the SQL Server blog (AS is only Windows at this time)?
- Anonymous
- Anonymous
January 27, 2017
Hi I have not seen Reporting Services - SharePoint Mode in SQL Server vNext. I can see only supports native mode. What is the reason behind it? Will get the sharepoint mode features in next CTP releases?ThanksHari- Anonymous
January 27, 2017
Please ask this on the SSRS blog
- Anonymous
- Anonymous
February 09, 2017
Well Done! thank you so much for adding IN operator. - Anonymous
February 12, 2017
Hi,is there any feature to disable selected tabular cube ? so it can release all the memory allocation usage, and leaving only the metadata from the tabular server ?- Anonymous
February 20, 2017
There's no such feature yet. What's the scenario you are trying to enable?- Anonymous
January 01, 2018
The scenario is e.g. If we want to temporary deactivate a selected cube and release the resources to be used by other cubes. Thanks
- Anonymous
- Anonymous
- Anonymous
January 01, 2018
Hiregading the"Object-Level Security" feature in SSAS 2017. Can it be used to hide specific Measure or Calculated Columns to selected user ? Thanks