Logging and Counters in App Fabric Cache
The following is a good place to get started with how to go about collecting basic information for monitoring and/or troubleshooting an App Fabric (AF) cache setup (Host/Cluster and clients). It starts by pointing to some resources on the different available logging features and then, via a sample scenario, goes over the decision taken to implement a logging solution. Additionally, it answers a frequent customer question on what are the basic recommended performance counters to collect.
What App Fabric Cache offers
Here is a quick walk through on how to better format and generate the log generation for ease of management, some of the links within are pre-release so you may refer to the following more updated ones, server log sink settings and client log sink settings. These should give a fairly good idea on the logging capabilities offered in AF Cache, please review the given links, as its knowledge will help further reading. With these concepts, the discussion and planning on what is the best suitable logging solution for your specific implementation can start.
A Sample Scenario
Assuming that memory pressure issues are a concern on the host side. The default event trace level of ERROR would not be enough as it would be necessary to have a more detailed sense of what objects are being cached on the host. This can be done by overriding the default host log sink to collect information level logs, enabling more detailed log analysis in the case of memory related errors. 5 different levels are provided: No Tracing (-1), Error (0), Warning (1), Information(2), Verbose(3). In this sample, the Information level will be taken.
At that point the next decision will be to determine if the configuration setting should be performed via code or XML (configuration file). In this sample, the organization decides that their Infrastructure personnel can handle the required changes via XML and no programmers will be required (no code needed) and hence the XML solution is the simplest.
Next is the type of logging – as the same infrastructure team will also be analyzing the logs, a file-based log sink is agreed upon (versus console or Event Tracing for Windows - ETW). For the sake of simplicity and to ease the understanding of the sample in this blog, AF Cache logging was chosen. ETW logging is a viable option as well. Since the logs will be written into an existing central shared location on the network, the NETWORK SERVICE account is given rights to the share (in the case of a cluster, each host NETWORK SERVICE account will have to be added to have write access to this share). NOTE that AF Cache service ONLY runs under the NETWORK SERVICE account of the server (which is the account assigned to the computer by the domain), the service cannot run as any other account, such as an independent (not server/local machine account) Network user or group.
In the case of an outage the logs could be overwritten, to alleviate this, the process-specific character ($) is agreed upon and it is to be used within the log name. Also, the log generation interval is settled for every hour (dd-hh).
Similarly, since memory pressure on the webservers (AF cache client) is also a concern, the client logs sink needs similar changes. The final custom type attribute for client and host for the fabric object will then look similar to the following:
<customType
className="System.Data.Fabric.Common.EventLogger,FabricCommon"
sinkName="System.Data.Fabric.Common.FileEventSink,FabricCommon"
sinkParam=\\CentralLogs\\AFCache\\Server1- $/dd-hh
<!-- For the client machines the log name are modified: sinkParam="\\CentralLogs\\AFCache\\Client1- $/dd-hh" –>
defaultLevel="2"
/>
Logs are a good way to collect application specific or, as in the case above, scenario specific information that will allow for ad-hoc or error-driven analysis. Similarly, collecting performance counters can give a window in the internal operations of not only the particular application (AF cache) but also of the overall system.
Performance Counters
As a complement to the above, here is a list of recommended performance counters to aid in monitoring (for later analysis) and troubleshooting AF cache issues. The table contains the names for the performance monitor counters and the important instances to monitor. A small comment follows each counter grouping.
Counter Name |
Running Instance |
Counter Instance |
Comments |
AppFabric Caching:Host |
|
All (*): Cache Miss Percentage,Total Client Requests, Total Client Requests /sec, Total Data Size Bytes, Total Evicted Objects, Total Eviction Runs, Total Expired Objects, Total Get Requests, Total Get Requests /sec, Total GetAndLock Requests, Total GetAndLock Requests /sec, Total Memory Evicted, Total Notification Delivered, Total Object Count, Total Read Requests, Total Read Requests /sec, Total Write Operations, Total Write Operations /sec |
For obvious reasons all the host counters are included. For memory troubleshooting and monitoring, the counters “Total Data Size Bytes” and “Total Object Count” are relevant. Also, a high level of evictions (Total Memory Evicted) may indicate memory pressure. |
.NET CLR Memory |
Distributed CacheService |
# Gen 0 Collections, # Gen 1 Collections, # Gen 2 Collections, # of Pinned Objects, % Time in GC, Large Object Heap size, Gen 0 heap size, Gen 1 heap size, Gen 2 heap size |
These counters will give a fuller spectrum on what is taking place with the CLR memory. For instance, a large “% Time in GC” would indicate that too much garbage collection (GC) is taking place, and the CPU will provably be working extra to process the GC. Memory pressure may therefore be an issue. See this blog for further details |
Memory |
N/A |
Available MBytes |
The preference will be to keep this at above 10% of total memory and plan to have available space for high traffic times. |
Process |
Distributed CacheService |
% Processor Time, Thread Count, Working Set |
A small working set could imply memory pressure from AF Cache as oppose to other processes in the box. |
Process |
_Total |
% Processor Time |
Monitoring the total process time will tell which application(s) are competing for CPU resources. |
Network Interface |
All (*): Bytes Received/sec, Bytes Sent/sec, Current Bandwidth |
As long as memory and Garbage Collection are not an issue then the CPU should be expected to work well and a lot of throughput can be handle. At this point a slow network card or any network point from there to the client may become the bottleneck. Monitor the network interfaces to ensure that they are not saturated. |
Adding the counters
To avoid having to include all the counters above one-by-one, download this performance counter data collection set template and import it to the server, as follows (alternative you can also use this more generic instructions):
- From the run command type “perfmon” and hit enter.
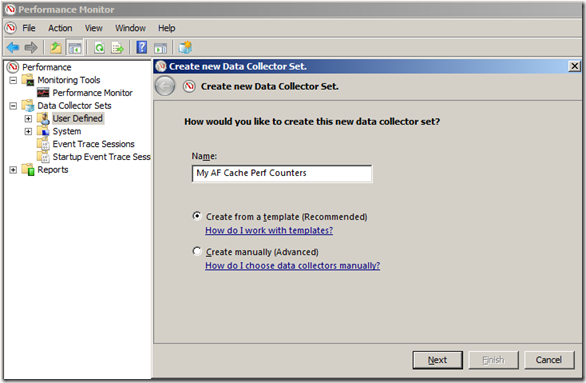
- From the tree view, open “Data Collector Sets”, right click on “User Defined” and then choose “New” > “Data Collector Set”, this screen should appear, enter a suitable name and choose “Create from a template (Recommended)”.

- Click “Next” and on do not choose any of the basic templates, instead click “Browse…”, load the downloaded XML file template
- Click “Next” and Browse to the drop directory you wan to setup, make sure it is not already been use by other counters, otherwise it may not work or maybe to difficult to recognize one counter from another, and click “Finish”. Alternatively, click on “Next” and then choose “Open properties for this data collector set” and you will get a chance to review all the settings before finishing.
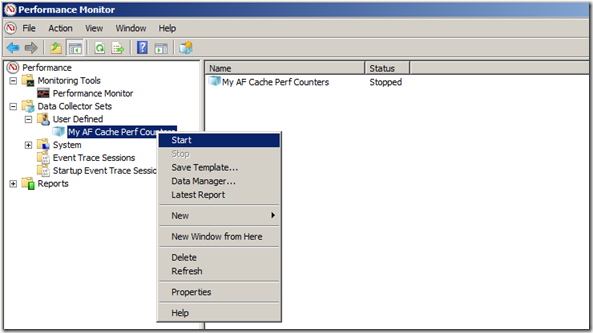
- Right click on the recently created Data collector set and hit Start, as shown

- Click “stop” once you are done collecting counters and collect the counters from the drop directory.
In summary
Both logs and performance counters collected together are the first step in being ready to analyze errors or monitor for specific concerns or conditions (i.e. memory pressure) with AppFabric Caching.
Since this is a big subject, I will look into further exploring the reasons behind the performance counters recommendation in a future blog.
Author: Jaime Alva Bravo
Reviewers: Mark Simms; James Podgorski; Rama Ramani
Comments
- Anonymous
August 01, 2011
I am assuming all this is valid for On-Premise world? - Anonymous
August 02, 2011
All these is from on-prem. For the cloud, the Memory, Process (_Total) and Network Interface counters are the only ones available. To get to them, you have to remote desktop to your Azure compute node.