APS/PDW Query Performance: Lock Status
A common scenario customers report is queries which ran quickly yesterday, are taking longer today. Today I want to cover one aspect that may be causing this behavior: locks.
Most appliances out there have a combination of ETL, ELT, and ad hoc queries. It is possible one of those ad hoc queries is blocking the load, or vice versa. There are two types of resources needed to run a query in PDW, concurrency locks and object locks at a PDW level. Without both of these, a query will be in a queued state.
Administration Console
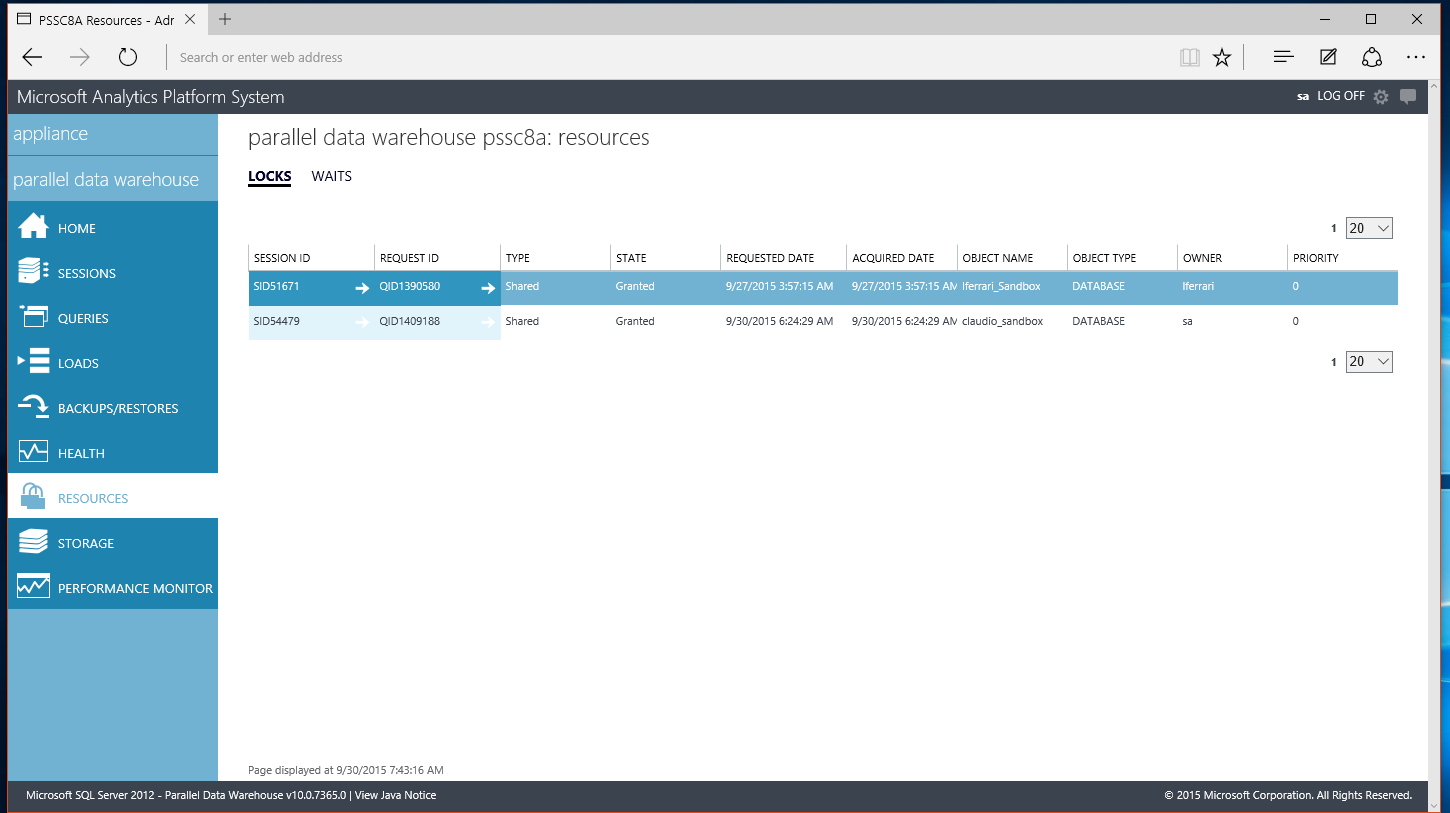
If the issue is occurring now, you can always look in the Administration Console under the Parallel Data Warehouse, Resources tab. Here you will find two tabs which show the different type of locks needed in PDW.
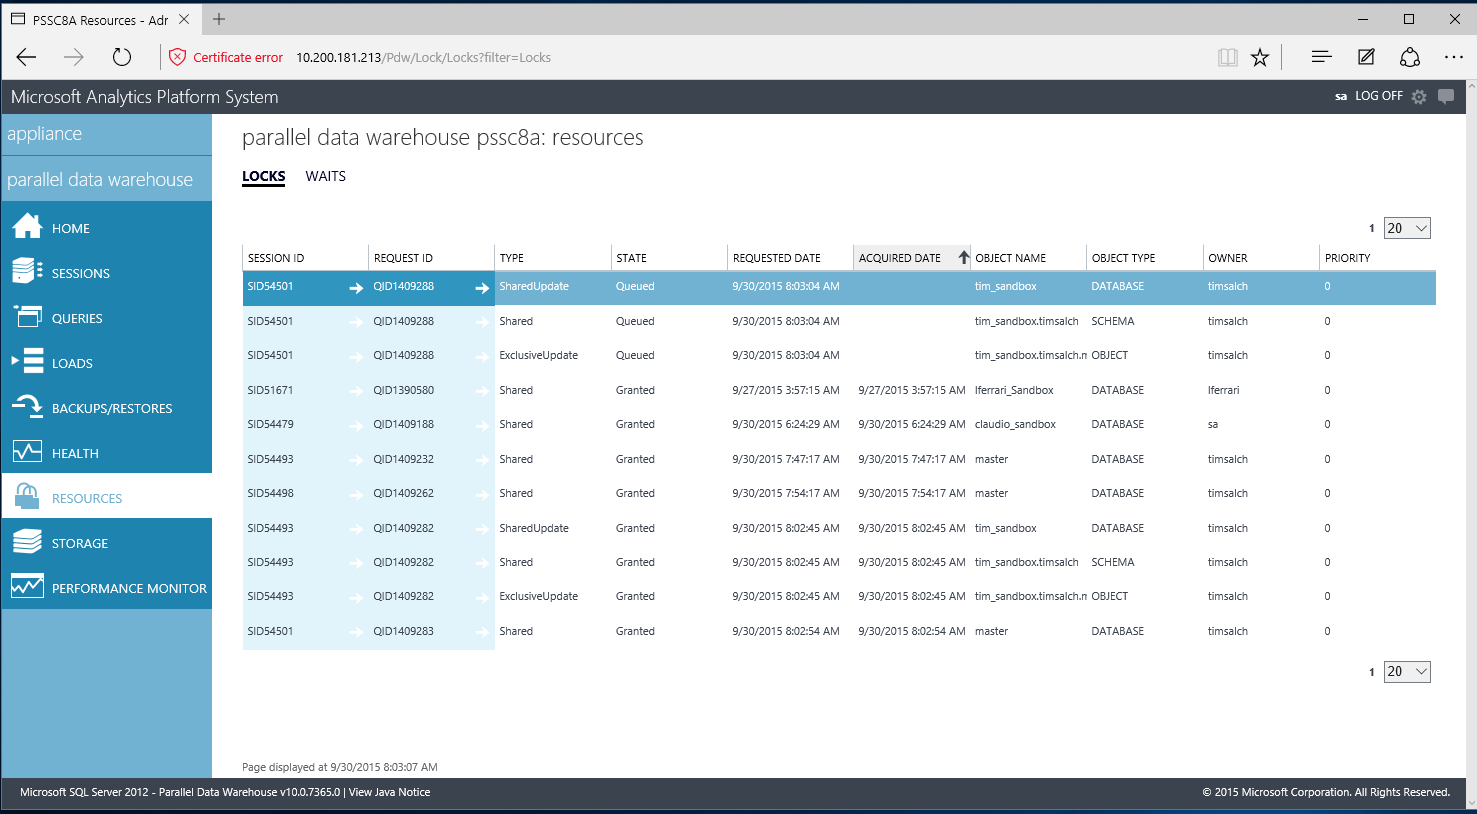
The LOCKS tab will show all object related lock requests. The WAITS tab will show all concurrency lock requests. Both tabs will show currently granted requests along with currently waiting requests. The easiest way to check for any queued requests in either tab is to order each page by 'STATE' or 'ACQUIRED DATE' by clicking on the column header. Any request that has not been granted will have a state of QUEUED and ACQUIRED DATE will be NULL.
Another useful column to sort by is the object name column. This will show you all request grouped by object name. This view can help identify what session has a lock on the object and what session is waiting for a lock on the object.
In this example, you can see SID545501 has queued locks for the database, schema, and the object. Looking at the object locks, I can see SID54493 has been granted an ExclusiveUpdate lock. Since a session will not take any level of locks until all locks needed can be granted, all locks for SID545501 will be queued until they are able to be granted.
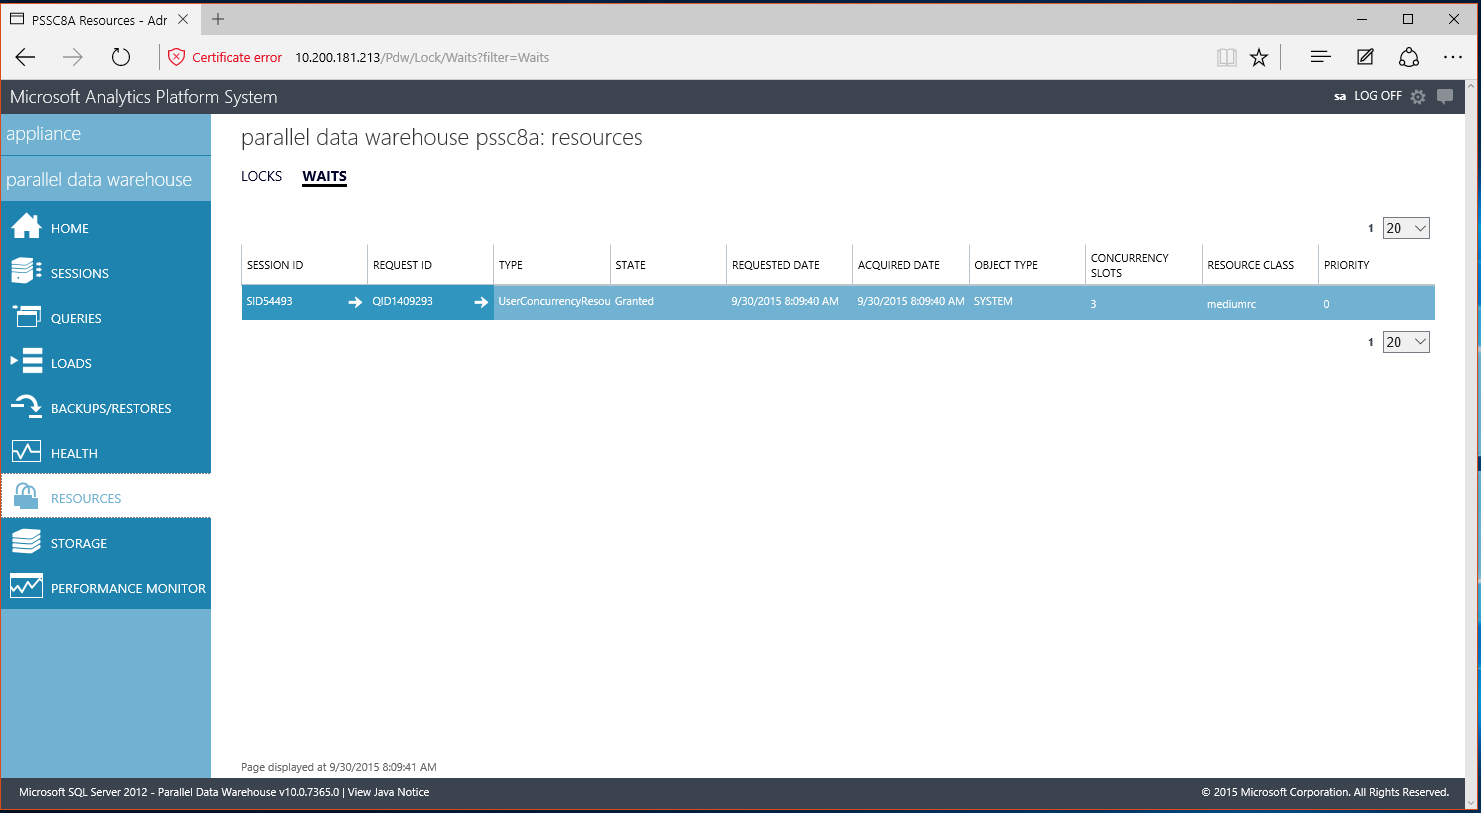
The WAITS tab shows the concurrency locks granted. The concurrency locks will only be granted once all object locks have been granted and the query is currently running. In this example, there is only one query that is currently active.
DMV Data
As with all data presented in the admin console, the lock data is also available in DMV's. It may be easier on a busier system to pull the data directly from the DMV's and filter it to only show the interesting points.
There are three DMV's which contain the data for lock requests.
sys.dm_pdw_resource_waits - Will show all concurrency locks and is the source for the WAITS tab in the admin console
sys.dm_pdw_lock_waits - Will show all object locks and is the source for the LOCKS tab
sys.dm_pdw_waits - Combines the data from other two DMV's to give an aggregated view.
Historical Data
Both the admin console and the DMV data show only a current snapshot of the granted and queued requests. They will not give any historical data. It is possible though to look at the query execution to tell if it was blocked on concurrency locks, object locks, or in actual execution. The following query will show this information:
SELECT TOP 10 session_id,
request_id,
Cast(start_time - submit_time AS TIME(4)) AS queued_time,
Cast(end_compile_time - start_time AS TIME(4)) AS compile_time,
Cast(end_time - end_compile_time AS TIME(4)) AS execution_time,
total_elapsed_time
FROM sys.dm_pdw_exec_requests
WHERE total_elapsed_time > 0
--Use this to order by queries waiting on user concurrency locks
--order by queued_time desc
--Use this to order by queries waiting on object locks and PDW plan generation
ORDER BY compile_time DESC
--Use this to order by actual query execution time
--order by execution_time desc
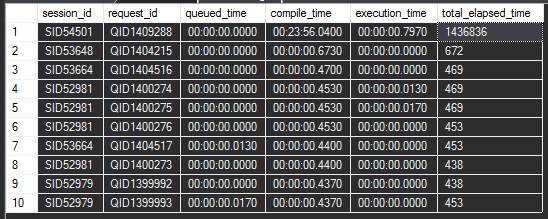
Example results:
This example shows SID54501 spent 23 minutes and 56 seconds in compilation time, which includes time spent waiting to acquire object locks.
Feel free to comment with any queries of your own you have found useful and questions are always welcome.
The example used in this post included running a DML statement inside an explicit transaction from SID54493 and not commiting it. SID54501 is then executing a DML operation against the same object, which will be blocked on exclusive object locks.
Comments
Anonymous
December 31, 2015
Very good post ...... Appreaciate the clear and crisp explanation!!!Anonymous
December 31, 2015
Hi Tim, Is it possible to persist query history in PDW within a table ? From DMV the records to be purged to a table. Thanks for your guidance. regards, Subramanian kaushik GurumoorthyAnonymous
January 05, 2016
There is not a built in way in PDW to have a record persisted to a permanent table before it is purged. You can set up external process to monitor the records and insert them into a permanent table before it is purged. The Microsoft PFE team actually has a tool that can do this, you can speak to your TAM about getting this implemented. Otherwise you can write some logic to see when a entry is getting close to record number 10K and insert it into a user table. You should be able to query based off queryID and submit time to find out how close a record is to being purged, which will happen when it becomes record number 10,001 and is not active.Anonymous
January 09, 2016
Hi Tim, Thanks a lot for your guidance, we have requested our TAM more information on it. Happy new year ahead. regards, Subramanian kaushik GurumoorthyAnonymous
February 29, 2016
Hi Tim, I went through the SQL - PDW migration guide and found that its recommended to have replicated table size not greater than 5 GB. Is that a recommendation for size of replicated table across appliance (Total size) or across nodes (Size per node) ? regards, gskaushik- Anonymous
June 21, 2016
This size recommendation is referring to the size of the table itself, not taking into account any replication. This is to be used as a starting point, and can be adjusted based on your workload. Just keep in mind that a replicated table is taking up that amount of space on every node. So on a 10 node system, a 5GB replicated table is taking up 5GB on every node and therefore has a total appliance storage footprint of 50GB.
- Anonymous


