Data Capturing and Analysis using SQL Server 2008 Activity Monitor and SQL DMV’s
In this blog, I will be sharing a unique instance of data capturing and analysis using SQL Activity monitor ,SQL DMV’s and also their correlation.
We usually tend to see Activity monitor for a quick understanding of SQL health and resource consumption. Here is a scenario very close to Network IO in Activity monitor.
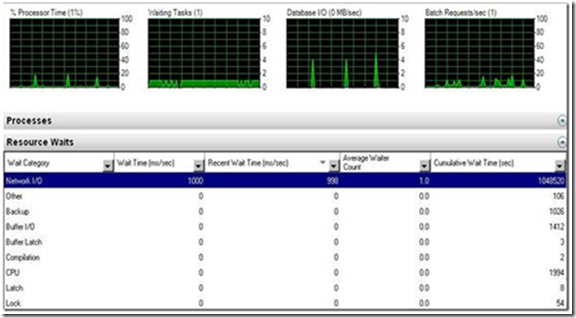
Below is the screen shot depicting Network IO operation in one of my SQL Server troubleshooting cases.

Here we observe that there are some waits happening on NetworkIO and this data is collected internally using sys.dm_os_wait_stats DMV’s view.
Let me take you further into this, how we can establish the correlation between SQL Activity monitor and DMV which we can use in our normal administration work with SQL Server Network IO troubleshooting.
Looking at the above Activity monitor, SQL Administrator have a general perception that network IO mean something to do only with Network Lines, however its more than that. Activity monitor represents Network I/O as waits on OLEDB, MSQL_DQ, DTC_STATE, DBMIRROR_SEND and ASYNC_NETWORK_IO.
In this scenario customer was running SQL Server profiler trace on the SQL server capturing data and we could observe Network I/O in activity monitor.
Checked sys.dm_os_waiting_tasks and found that there was a task waiting on oledb and Found that session was executing stored procedure to gather the profiler data (dbcc inputbuffer(<session_id>)):
(@P1 int) exec sp_trace_getdata @P1, 0
Checked sys.dm_os_wait_stats view and found some waits on oledb also checked sys.dm_exec_requests view and found that the session was waiting on oledb.
In the above scenario it was clear that the issue was oledb waits which are quite normal when we capture profiler traces.
We can reproduce the same scenario on our box using below steps.
1. Start a normal profiler trace.
2. Run the activity monitor and see the waits.
3. Query the view: sys.dm_os_waiting_tasks and check the Session id waiting on oledb.
4. Run dbcc inputbuffer(<session_id>), you will see the query text: -“exec sp_trace_getdata”
5. Stop the trace and the waits will not be there
In the above scenario we had visibility of waits in the sys.dm_exec_requests view and sys.dm_os_wait_stats DMV as well as in activity monitor.
But what if, there are no waits observed in sys.dm_exec_requests DMV for any resource but in activity monitor and sys.dm_os_wait_stats view.
Here is another case study where we see waits in activity monitor and sys.dm_os_wait_stats but no wait in sys.dm_exec_requests.
Step 1: open activity monitor and check resource waits.
Step 2: Run a select statement which returns more than 1000 rows
e.g. select * from <Table Name>
Step 3: Now you will see the network waits in activity monitor.
Step 4: Query the sys.dm_exec_requests view and there will be no waits by that session.
Step 5: select * from sys.dm_os_wait_stats where wait_type='async_network_io'
Step 6: Run the query in step 2 and then repeat step 5
You will see the increase in async_network_io waits.
Hence we need to look at the DMV’s before we draw any conclusion on the basis of activity monitor. It’s also a best approach to correlate the data with Perfmon counters to reach a conclusion.