WCF Extensibility – System.Diagnostic Tracing
This post is part of a series about WCF extensibility points. For a list of all previous posts and planned future ones, go to the index page .
This post takes again a detour from the normal flow of the series, as the extension I’ll be covering today isn’t a WCF extensibility per se, but it can be used to solve some real issues and since I’ve seen a post last week with an issue which can be solved exactly by the example in this topic, I decided to jump into tracing before going back to “normal” WCF extensibility.
Tracing is a very powerful tool in WCF. I think I've answered tens of questions in the MSDN forums with "enable tracing and find out the exception which caused the problem" and in most of the cases just that was enough for the the user to find out the issue – you look at the trace file generated by the diagnostic subsystem using the Service Trace Viewer Tool, look for the “line in red” (how the tool marks exceptions which were thrown or handled by the WCF runtime), and in most cases there will be the exception there explaining the problem. This is often seen in questions such “my client got a 400 response” or “the server forcefully closed the connection”. Notice that the tracing subsystem is a lot more powerful then just tracing exceptions (correlating a message between the client and the server, message time charts, etc.), but I’ll focus on the error aspect in this post.
This series is about places where one can hook up code to be executed in the WCF pipeline, but almost all of the examples of tracing I’ve seen simply add some information in the application configuration file which saves the traces in the file system for later analysis. But it doesn’t have to be this way. The tracing subsystem can also be extended, and it has been in the past for scenarios such as where one cannot access the trace file on a machine (i.e., in shared hosting environments) or to capture errors which the “normal” means (such as IErrorHandler) cannot detect.
The tracing subsystem is based on some sources which send data to a list of listeners. Many features in the .NET Framework act as event sources: System.Net and System.Net.Sockets (for networking traces), System.Runtime.Serialization (for traces in the WCF serialization subsystem), System.ServiceModel (the “main” WCF traces) and so on. All sources fire events to the subsystem under certain circumstances (e.g., when a message arrives to a WCF encoder, when some bytes are sent over a socket, when a new dynamic class is generated for serialization, etc.). The “Configuring Tracing” page on MSDN is the main source of information about tracing in WCF, and it describes the tracing sources in the platform. There’s one more missing from the list in that page, which is the System.Runtime.Serialization.CodeGeneration, which logs the IL generated (and executed) by the serialization subsystem for dynamic classes generated by WCF (to improve the performance of serialization / deserialization of objects). This is hardly ever used, though.
The listeners are simply subclasses of the abstract TraceListener class. As I mentioned, while most examples use one of the .NET classes (such as TextWriterTraceListener or XmlWriterTraceListener), one can provide its own implementation of the TraceListener and handle the messages from there.
- public abstract class TraceListener
- {
- public abstract void Write(string message);
- public abstract void WriteLine(string message);
- }
The implementation of a TraceListener subclass (at least one to handle WCF traces) is fairly simple, as one only needs to override the two methods used to write tracing information to the listener: Write (which is used to write partial traces) and WriteLine (which “finishes” the trace entry). It’s similar to a console: each entry is written in a “line” (what the listener decides to do with the lines is up to the listener itself, whether it actually writes it out to the console, saves on a database, or does something else).
How to enable tracing
The “Configuring Tracing” page in MSDN is the official source for enabling tracing in WCF. You’ll simply add the <system.diagnostics> section to your configuration file (either app.config or web.config, depending on whether the service is self-hosted or hosted in IIS) to define the sources and the listeners, and the tracing subsystem takes care of connecting the two.
- <configuration>
- <system.diagnostics>
- <sources>
- <source name="System.ServiceModel"
- switchValue="Information, ActivityTracing"
- propagateActivity="true">
- <listeners>
- <add name="traceListener"
- type="System.Diagnostics.XmlWriterTraceListener"
- initializeData= "c:\log\Traces.svclog" />
- </listeners>
- </source>
- </sources>
- </system.diagnostics>
- </configuration>
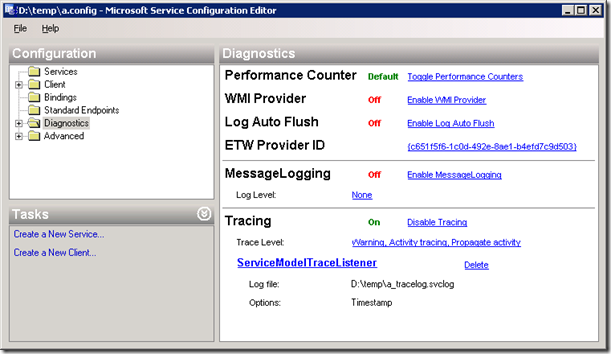
Another way is to use the Configuration Editor Tool (SvcConfigEditor.exe) – which is what I end up using most of the times, as I often don’t remember the syntax for the configuration file. Just load up the configuration file on it, select the “Diagnostics” folder, and click “Enable Tracing” – it will add the required elements for enabling tracing for the System.ServiceModel source.
One issue that people often face when enabling traces for IIS-hosted services and writing the traces to a file: the user account on which the service is running (by default it’s NETWORK SERVICE) must have write access to the folder where the file is to be written to. On NTFS-based systems, this account by default doesn’t have that access, so you must explicitly grant access to it to be able to see the trace file.
Real world example: collecting traces in shared hosting scenarios
Last week I found an interesting question in that a user wanted to use tracing, but since the service was hosted in a shared servicing account, accessing the file system was not an option. That reminded me of a nice feature in the WCF RIA Services Toolkit, the InMemoryTraceListener class which, along with the TracingDomainServiceEndpointFactory class, adds an endpoint which can be used to query the traces generated from all the services running in the application domain – see more information about this feature in this post from Tomasz Janczuk. So I decided to follow the same pattern and try to solve the problem: add an additional “tracing” service which can serve the traces for the other services in the same IIS Application (which share the same AppDomain).
As usual, I’ll start the example with a service. I’ll keep things simple, with the same calculator service which has been extensively used.
- [ServiceContract]
- public interface ICalculatorService
- {
- [OperationContract]
- int Add(int x, int y);
- [OperationContract]
- int Subtract(int x, int y);
- [OperationContract]
- int Multiply(int x, int y);
- [OperationContract]
- int Divide(int x, int y);
- }
- public class CalculatorService : ICalculatorService
- {
- public int Add(int x, int y)
- {
- return x + y;
- }
- public int Subtract(int x, int y)
- {
- return x - y;
- }
- public int Multiply(int x, int y)
- {
- return x * y;
- }
- public int Divide(int x, int y)
- {
- return x / y;
- }
- }
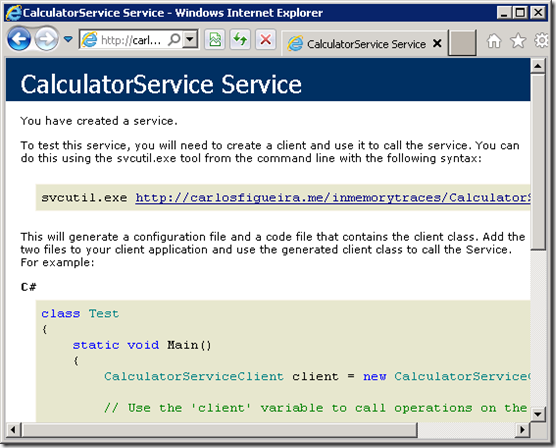
The implementation is fairly simple, and I built it and deployed it to my GoDaddy account, using the default configuration. So far, so good:
I can now write my client code – create a new project, add a service reference, and call the methods on my calculator.
- public static void Main()
- {
- CalculatorServiceClient c = new CalculatorServiceClient();
- Console.WriteLine(c.Add(44, 55));
- Console.WriteLine(c.Subtract(333, 66));
- Console.WriteLine(c.Multiply(24, 48));
- Console.WriteLine(c.Divide(12, 0));
- }
When I run the code, however, the last call throws an exception:
Error: System.ServiceModel.FaultException: The server was unable to process the request due to an internal error. For more information about the error, either turn on IncludeExceptionDetailInFaults (either from ServiceBehaviorAttribute or from the <serviceDebug> configuration behavior) on the server in order to send the exception information back to the client, or turn on tracing as per the Microsoft .NET Framework 3.0 SDK documentation and inspect the server trace logs.
But since we don’t have access to the file system on the shared hosting account, we can’t really enable traces in the “normal” way. Enter the InMemoryTraceListener to the rescue.
And before I go further, the usual disclaimer: this is a sample for illustrating the topic of this post, this is not production-ready code. I tested it for a few services and it worked, but I cannot guarantee that it will work for all scenarios – it stores the traces in a static cache, so if the Application Pool is recycled, it will be lost (if this is a problem, then the trace listener may want to save the traces in a persistent storage such as a database). It also doesn’t have any security to prevent unauthorized access to the traces (if those traces are only to be used during development, this is not an issue, but for production systems it should be locked down).
In order to create the trace listener, we need to override the TraceListener class. One important thing to know is that all the WCF traces follow a certain pattern:
<source name> <trace level>: <trace id> : <trace data>
Where <source name> is the name of the source which is generating the traces; trace level is the type of event from the TraceEventType Enumeration; trace id is a unique identifier for the trace (which as far as I know is not documented) and finally trace data is a XML-based representation of the trace information (other trace sources don’t use XML as the trace data). Given that the data has a pre-defined format, it’s fairly easy to parse it and do something other than save to a file, as I’ll show later in the sample.
Below is the implementation of the InMemoryTraceListener class. The MaxTraceEntries is configurable via the “initializeData” attribute of the listener element (it’s passed to the constructor as a string), and since it changes a static variable, it can only be used once (as a shared listener). The implementation of Write simply saves the string in the current entry. When WriteLine is called, then the entry is “ready”, and the code validates that it indeed comes from the System.ServiceModel source (to support other WCF trace sources you’d need to update the regular expression), and if so, it will save the trace record in a XElement instance, which is added to a queue. If the size of the queue exceeds MaxTraceEntries, then the oldest elements of the queue are discarded. Finally, an internal GetEntries method is exposed to return the entries, in the reverse order in which they were added (so that the most recent are listed first) to the service which will actually expose the traces.
- public class InMemoryTraceListener : TraceListener
- {
- static int maxEntries = 200;
- static ConcurrentQueue<XElement> entries = new ConcurrentQueue<XElement>();
- static string currentEntry;
- internal static int MaxEntries
- {
- get
- {
- return maxEntries;
- }
- set
- {
- if (value <= 0)
- {
- throw new ArgumentOutOfRangeException("value", "The 'maxEntries' attribute must be a positive integer");
- }
- maxEntries = value;
- }
- }
- public InMemoryTraceListener()
- : base()
- {
- }
- public InMemoryTraceListener(string initializeData)
- : base()
- {
- int maxTraceEntries;
- if (int.TryParse(initializeData, NumberStyles.None, CultureInfo.InvariantCulture, out maxTraceEntries))
- {
- InMemoryTraceListener.MaxEntries = maxTraceEntries;
- }
- }
- public override void Write(string message)
- {
- if (message == null)
- {
- throw new ArgumentNullException("message");
- }
- currentEntry = currentEntry == null ? message : currentEntry + message;
- }
- public override void WriteLine(string message)
- {
- this.Write(message);
- Match wcfTrace = Regex.Match(currentEntry, "System.ServiceModel [^:]+: (\\d+) : ", RegexOptions.Compiled | RegexOptions.IgnoreCase);
- if (wcfTrace.Success)
- {
- int traceRecordEnd = currentEntry.IndexOf(@"</TraceRecord>", StringComparison.Ordinal);
- if (traceRecordEnd > 0)
- {
- int traceRecordStart = wcfTrace.Index + wcfTrace.Groups[0].Length;
- int traceRecordLength = traceRecordEnd + 14 - traceRecordStart;
- string xml = string.Format(CultureInfo.InvariantCulture, @"<Trace><Timestamp>{0}</Timestamp><Code>{1}</Code>{2}</Trace>",
- DateTimeOffset.Now.UtcTicks, wcfTrace.Groups[1],
- currentEntry.Substring(traceRecordStart, traceRecordLength));
- entries.Enqueue(XElement.Parse(xml));
- currentEntry = currentEntry.Substring(traceRecordStart + traceRecordLength);
- XElement trash;
- while (entries.Count > maxEntries)
- {
- entries.TryDequeue(out trash);
- }
- }
- }
- }
- internal static XElement[] GetEntries()
- {
- return entries.Reverse().ToArray();
- }
- }
Next is the service which will expose the traces. Like the endpoint added by the TracingDomainServiceEndpointFactory class, this example also exposes the traces in three formats: plain XML, ATOM and HTML. It’s implemented as a simple REST service with a single [WebGet] operation, based on a query string parameter used to define the trace format. The implementation of the methods to create the actual responses are left to the code gallery page.
- [ServiceContract]
- [ServiceBehavior(InstanceContextMode = InstanceContextMode.Single)]
- public class TraceService
- {
- const string TraceTitle = "WCF In Memory Traces";
- [WebGet(UriTemplate = "traces?format={format}")]
- public Message GetTrace(string format)
- {
- if ("xml".Equals(format, StringComparison.OrdinalIgnoreCase))
- {
- return WebOperationContext.Current.CreateStreamResponse(CreateTraceXml(), "text/xml");
- }
- else if ("html".Equals(format, StringComparison.OrdinalIgnoreCase))
- {
- return WebOperationContext.Current.CreateStreamResponse(CreateTraceHtml(), "text/html");
- }
- else if (string.IsNullOrEmpty(format) || "atom".Equals(format, StringComparison.OrdinalIgnoreCase))
- {
- return WebOperationContext.Current.CreateAtom10Response(CreateTraceSyndicationFeed());
- }
- else
- {
- throw new InvalidOperationException("In memory traces traces can only be obtained in ATOM (default), XML or HTML format. Use URI \".../traces?format=xml\" to request XML, or \".../traces?format=html\" to request HTML");
- }
- }
- }
Now let’s add another service definition to the IIS application. Somehow I couldn’t use the WebServiceHostFactory to work on GoDaddy, so I reverted to web.config to set up the new service. It’s also on the configuration file which we hook up the System.ServiceModel source with our trace listener. And since I’m mostly interested in the error tracing, I’ll leave the trace level to a high value (Warning here)
- <?xml version="1.0"?>
- <configuration>
- <system.web>
- <compilation debug="true" targetFramework="4.0" />
- </system.web>
- <system.serviceModel>
- <behaviors>
- <serviceBehaviors>
- <behavior name="">
- <serviceMetadata httpGetEnabled="true" />
- <serviceDebug includeExceptionDetailInFaults="false" />
- </behavior>
- </serviceBehaviors>
- <endpointBehaviors>
- <behavior name="Web">
- <webHttp/>
- </behavior>
- </endpointBehaviors>
- </behaviors>
- <serviceHostingEnvironment multipleSiteBindingsEnabled="true"/>
- <services>
- <service name="ServiceWithInMemoryTraces.TraceService">
- <endpoint address=""
- behaviorConfiguration="Web"
- binding="webHttpBinding"
- contract="ServiceWithInMemoryTraces.TraceService"/>
- </service>
- </services>
- </system.serviceModel>
- <system.diagnostics>
- <sources>
- <source name="System.ServiceModel"
- switchValue="Warning"
- propagateActivity="false">
- <listeners>
- <add name="InMemoryTraceListener" />
- </listeners>
- </source>
- </sources>
- <sharedListeners>
- <add name="InMemoryTraceListener"
- type="ServiceWithInMemoryTraces.InMemoryTraceListener, ServiceWithInMemoryTraces"
- initializeData="500"/>
- </sharedListeners>
- </system.diagnostics>
- </configuration>
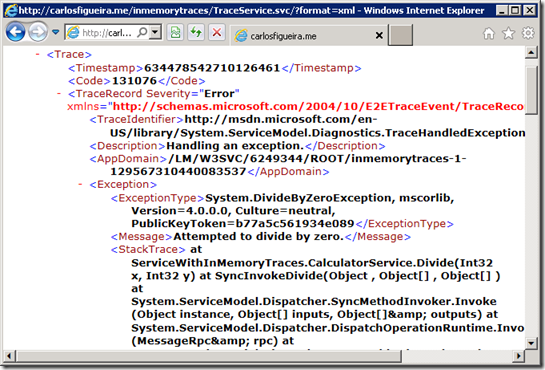
Now if we run the client again, it should have traced some information to our tracing service. And browsing to it, here is the reason why the client failed.
And that’s it. Although the tracing system isn’t part of WCF per se, WCF uses it enough that it’s worth calling out that it can be integrated with yet another WCF service to expose the information it collects.


