Making testing finite–a case study
One of the focus areas for AX'7' regression testing was creating form based automated regression tests using the new testability improvements in the product. This post will discuss how the product team prioritized the regression test development. The testability discussion will be covered in a future post.
In my last post, Testing is Infinite, I described a risk based approach to test prioritization. While the number of forms in AX'7' is not infinite, we do ship a few thousand forms and creating a regression suite for a few thousand forms is a very large task. We needed to look at the ROI for creating these tests on different forms and prioritize which ones to create tests for first.
The first step was to identify the relative importance of the form for regression testing. For this, I used the risk calculation example in my last post: Regression Exposure = (likelihood of regression) X (impact of regression). Here's how I defined the two inputs:
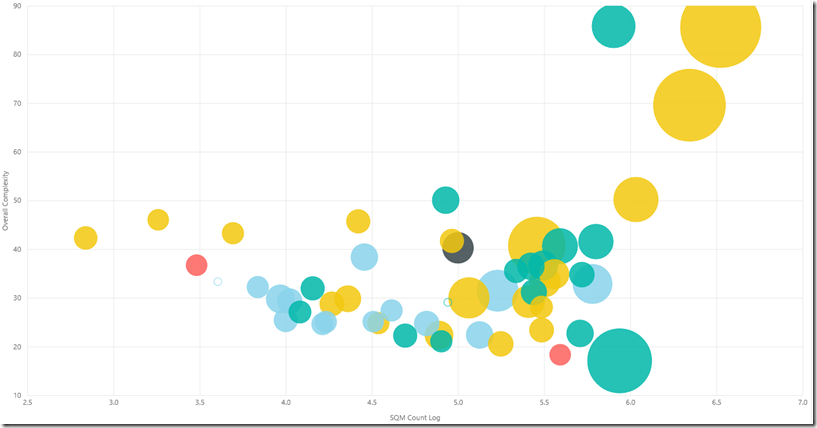
- Likelihood of regression - Intuitively, the probability of a regression goes up with the complexity of the artifact being changed. So I embarked on determining a complexity metric for forms. Ultimately, I settled on three factors: number of controls, number of data sources, and number of lines of code. Through the metadata API in the product, I found these three inputs for all forms, normalized each of them, and then used an average of the three factors to arrive at a complexity score for each form.
- Impact of regression - From a customer perspective, the more often a form is used the bigger the impact of a regression. Fortunately, we have data from AX 2012 showing form opens for customers that opted into SQM data collection. This data was used for the impact… well, actually the log value of the number of open forms to help take out some of the skew in this data.
From these two inputs, I calculated the risk exposure, or importance factor, for each form in the product. I took it one more step and categorized the forms into Most Important, High Importance, Medium High Importance, Medium Low Importance, Low Importance, and Not Important.
This data validated an assumption that many on the product team had - the most complex forms are also the most used forms in the system. In fact, the top three importance categories accounted for the vast majority of form opens in AX 2012:
Importance / Risk Category |
% of Total Forms in the Product |
% of Total Form Opens in AX 2012 |
| Most Important | 1% |
37% |
| High Importance | 2.5% |
22% |
| Medium High Importance | 15% |
37% |
Our prioritization activity became quite clear and measurable - focus on providing regression coverage starting with the most important forms. Just covering the top 1% was a huge step forward in providing regression coverage.
The last thing I'll mention is how we built some analytics to visualize the coverage of the forms. The Power BI (wicked cool, by the way) scatter chart below pulls complexity (Y-axis), AX 2012 usage (X-axis), and number of form opens in our regression tests (size of the bubble) together into one view. The most important forms for regression coverage are on the upper right of the chart. Those forms should also have the largest bubbles since they deserve the most test coverage. While this screen shot is limited to the Most Important forms, you can see that we generally followed the prioritization described in this post - build the most tests for the highest risk forms.
