VS2010 Beta 2 Concurrency Visualizer Parallel Performance Tool Improvements
Hi,
I'm very excited about the release of Visual Studio 2010 Beta 2 that is going to be available to MSDN subscribers today and to the general public on 10/21. This release includes significant improvements in many areas that I'm sure you'll love. But, as the Architect of the Concurrency Visualizer tool in the VS2010 profiler, I'm extremely thrilled to share with you the huge improvements in the user interface and usability of our tool. Our team has done an outstanding job in listening to feedback and making innovative enhancements that I'm sure will please you, our customers. Here is a brief overview of some of the improvements that we've made:
Before we start, I'll remind you again that the tool that I'm describing here is the "visualize the behavior of a multithreaded application" option under the concurrency option in the Performance Wizard accessible through the Analyze Menu. I've described how the tool can be run in a previous post. Here's a screenshot of the performance wizard with the proper selection to use our tool:

Ok, now let's start going over the changes. First, we've slightly changed the names of the views for our tool. We now have "CPU Utilization", "Threads", and "Cores" views. These views can be accessed either through the profiler toolbar's Current View pull-down menu, through bitmap buttons at the top of the summary page, or through links in our views as you'll see in the top left of the next screenshot.

You'll notice that the user interface has gone through some refinement since Beta 1 (see my earlier posts for a comparison) Let's go over the features quickly:
1. We've added an active legend in the lower left. The active legend has multiple features. First, for every thread state category, you can click on the legend entry to get a callstack based report in the Profile Report tab summarizing where blocking events occured in your application. For the execution category, you get a sample profile that tells you what work your application performed. As usual, all of the reports are filtered by the time range that you're viewing and the threads that are enabled in the view. You can change this by zooming in or out and by disabling threads in the view to focus your attention on certain areas. The legend also provides a summary of where time was spent as percentages shown next to the categories.
2. When you select an area in a thread's state, the "Current Stack" tab shows where your thread's execution stopped for blocking categories, or the nearest execution sample callstack within +/- 1ms of where you clicked for green segments.
3. When you select a blocking category, we also try to draw a link (dark line shown in the screenshot) to the thread that resulted in unblocking your thread whenever we are able to make that determination. In addition, the Unblocking Stack tab shows you what the unblocking thread was doing by displaying its callstack when it unblocked your thread. This is a great mechanism to understand thread-to-thread dependencies.
4. We've also improvement the File Operations summary report that is accessible from the active legend by also listing file operations performed by the System process. Some of those accesses are actually triggered on behalf of your application, so we list them but clearly mark them as System accesses. Some of those accesses may not be related to your application.
5. The Per Thread Summary report is the same bar graph breakdown of where each thread's time was spent that used to show up by default in Beta 1, but can now be accessed from the active legend. This report is a guide that helps you understand improvements/regressions from one run to another and serves as a guide to help focus your attention on the threads and types of delay that are most important in your run. This is valuable for filtering threads/time and prioritizing your tuning effort.
6. The profile reports now have two additional features. By default, we now filter out the callstacks that contribute < 2% of blocking time (or samples for execution reports) to minimize noise. You can change the noise reduction percentage yourself. We also allow you to remove stack frames that are outside your application from the profile reports. This can be valuable in certain cases, but it is left off by default because blocking events usually do not occur in your code, so filtering that stuff out may not help you figure out what's going on.
7. We added significant help content to the tool. You'll notice the Hints tab that was added and it includes instructions about features of the view as well as links to two important help items. One is a link to our Demystify feature, which is a graphical way to get contextual help. This is also accessible through the button on the top right hand side of the view. Unfortunately, the link isn't working in Beta 2, but we are working on hosting an equivalent web-based feature on the web to assist you and get feedback before the release is finalized. I'll communicate this information in a subsequent post. The other link is to a repository of graphical signatures for common performance problems. This can be an awesome way of building a community of users and leveraging the experiences of other users and our team to help you identify potential problems.
8. The UI has been improved to preserve details when you zoom out by allowing multiple colors to reside within a thread execution region when the same pixel in the view corresponds to multiple thread states. This was the mechanism that we chose to always report the truth and give the users a hint that they need to zoom in to get more accurate information.
The next screenshot shows you a significantly overhauled "Cores" view:
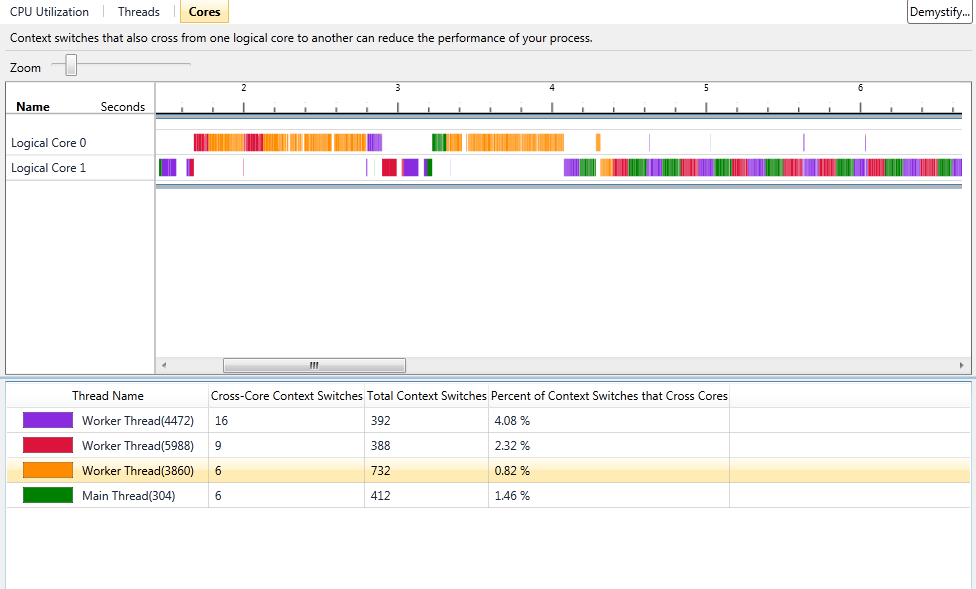
The Cores view has the same functionality; namely, understanding how your application threads were scheduled on the logical cores in your systems. The view leverages a new compression scheme to avoid loss of data when the view is zoomed out. It has a legend that was missing in Beta 1. It also has clearer statistics for each thread: the total number of context switches, the number of context switches resulting in core migration, and the percentage of total context switches resulting in migration. This can be very valuable when tuning to reduce context switches or cache/NUMA memory latency effects. In addition, the visualization can easily illustrate thread serialization on cores that may result from inappropriate use of thread affinity.
This is just a short list of the improvements that we've made. I will be returning soon with another post about new Beta 2 features, so please visit again and don't be shy to give me your feedback and ask any questions that you may have.
Cheers!
-Hazim
Comments
Anonymous
October 20, 2009
What version of Windows does this feature require? On my Server 2003 R2, it says "Requires infrastructure not available on this version of Windows"Anonymous
October 20, 2009
Hi, Thanks for your question. This feature is available on Windows Vista, Windows Server 2008, Windows 7, and Windows Server 2008 R2. Performance tuning performed on these platforms often improves the same applications running on previous Windows operating system versions that the tool doesn't run on.Anonymous
October 21, 2009
Hello, which VS2010 Ultilate,Premium or Professional is this tool included in?Anonymous
October 21, 2009
This tool is included in the Premium and Ultimate versions of Visual Studio 2010.Anonymous
October 22, 2009
Hi Hazim, The improvements are really useful to tackle multicore complexity. I love the new visualizations. :) I wanted to provide some feedback. I'm working on a quad-core CPU, Intel Core 2 Quad Q6600. The process of analyzing the data takes a lot of time. I've checked and it isn't taking advantage of multicore. The process runs on a single core. Are you planning to optimize the data analysis to take advantage of multicore CPUs. I think that it's possible and developers would benefit from this improvement in the final version. This tool is useful and I'd like to see it taking full advantage of my advanced development workstations. Again, great work. :) Cheers, Gaston HillarAnonymous
October 22, 2009
Hi Gaston, Glad to hear that you like the improvements. You bring up a great question that we've been considering for a while; namely, leveraging parallelism during analysis. There are many aspects to this that are too detailed to enumerate here, but the most important thing to recognize is that the process of analysis is significantly I/O bound. Imagine parsing the large amounts of data that we collect and then the symbol resolution that has to take place. We do leverage parallelism in certain areas, especially to keep the UI interactive when we do significant background work. Nevertheless, certain parts can be sped up by parallelism. I hope that we will have time to do some of this for the release, but it is unlikely since it may jeopardize quality at this stage of the development cycle. You should also be aware that we don't recommend collecting excessively long traces (>1-2 minutes). Also, we highly recommend that you create a symbol cache to avoid having to go out to the network during symbol resolution. Once your symbol cache is warmed up, you should see a significant improvement in analysis time. I hope this helps. Cheers, -HazimAnonymous
October 23, 2009
Hi Hazim, I understand your feedback. I was able to see huge performance improvements when running the process many times using the symbol cache. I'm working with a 16 GB RAM workstation with 4 RAID 0 hard drives. Therefore, I/O performance is faster than in other computers. I've run the profiler on other computers with 4 GB RAM and I noticed the I/O activity. Again, this is a great tool. I'm enjoying the new visualizations. :) I've already added a post about the tool on Dr Dobb's Go Parallel and I'll be using it to explain many concurrency issues. Cheers, Gaston HillarAnonymous
October 23, 2009
Gaston, Thanks again for the great feedback and for the wonderful article in Dr. Dobb's. Please don't hesitate to contact me if you need anything. Cheers, -HazimAnonymous
December 09, 2009
Hazim, Under what circumstances will the tool be unable to determine the unblocking stack for a monitor that has contention? Virtually all the contention I see in my application is the result of lock statements (blocking in @JITutil_moncontention@4), but the profiler does not seem to provide any hint of where the monitor is already owned (i don't see other threads with callstacks that involve it) and the unblocking stack is not able to be determined. Also, I'm seeing some blocking/contention in _stubraredisablereturn which seems to be related to pinvokes. Is there anything I can do to avoid the contention? Thanks, BrienAnonymous
December 09, 2009
The comment has been removedAnonymous
December 10, 2009
Hi Hazim, Thanks for the response, but I'm still not able to understand what I'm seeing: I have essentially 2 threads doing work. The problematic thread goes from Green (useful work) to Blue (Sleep) where the Blue section shows a stack trace that includes MyFunction() -> @JITutil_MonContention@4 which I take to mean that I tried to lock() on a monitor that was already owned. After that there is a series of small green and large blue chunks with the same stack in my code (no progress) which lasts for a few hundred milliseconds. Eventually the thread goes from blue to green and proceeds with normal useful work. The second thread seems to be chugging along just fine the whole time doing useful work. I can't seem to find any indication of either what caused the contention or what triggered the thread to come out of it's sleep and successfully acquire the monitor. I'm starting to suspect that maybe the first thread is being (unluckily) starved for the lock that it is trying to acquire. But I'm confused as to why it is contending for the lock in the first place, since the tool does not seem to show the stack trace that releases the contended lock.
With regards to the second question... It looks when my thread is blocked in a pinvoke to a winsock select() call (which is often) the GC is preventing the call from completing until the GC has been completed. I guess that's the way the GC works, but I'm not sure why that should cause contention. Anyway, I guess I should try to reduce my GCs rather than worry about the contention in this case. Thanks, Brien
Anonymous
December 10, 2009
Hi Brien, What you're describing is exactly what I was trying to explain. The monitor is spinning and calling Sleep/Yield every now and then instead of blocking (which is why there's no unblocking information). So, you've identified lock contention. The thread that's merrily running along is likely holding that monitor. By examining the callstack when the thread sleeps, you should identify the location in your application where it's trying to acquire a monitor and then figure out which monitor is involved so you may address the issue. Related to the GC behavior, you should be aware that when the GC kicks in, it is usually necessary to block threads while GC activity is taking place (there are actually two modes of this depending on the GC flavor that's running). If you are seeing significant garbage collection, then you should examine your memory usage. There are tools that can help with that and lots of info on the web. Cheers, -HazimAnonymous
December 21, 2009
Hi Hazim, Thanks, I think I've got a handle on it. I was able to find the stack (which was non-obvious because there was a shared lock with too big of a scope). I had to look at the final stack of the immediately preceding timeslice of the other thread. Thanks, Brien