VS2010: How to use the Parallel Performance Analysis Tools
This is a second post in the series about the parallel performance tools that my team is shipping in VS2010. In the previous post, I gave a quick overview of the features of our tools. In this post, I will demonstrate how you can start analyzing your multithreaded application's performance using the VS2010 Beta 1 release as a guide.
For the purposes of this tutorial, I'll assume that you have a solution of interest loaded and built in VS. Although that is not strictly needed to use our tool, we'll concentrate on this scenario for now. When you're ready to analyze your application, you should open the Analyze menu (if you can't find it, you're probably not using the VS Team System Beta 1, so see my previous post for a link).
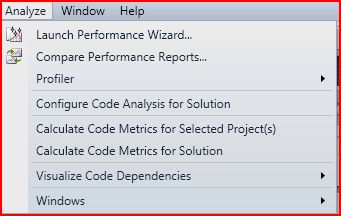
Choose the "Launch Performance Wizard" option, which will present you with the following:
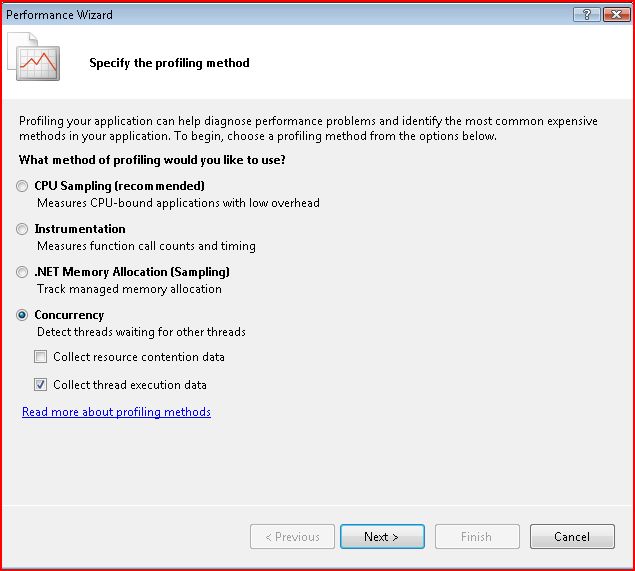
Select the "Concurrency" profiling method and select the second check box for our tool. The "resource contention" option is another cool tool that you should use, but for this series, we'll assume that the first option is turned off. Click "Next" and you'll be presented with a dialog to choose your application. In this case, my current solution shows up by default:
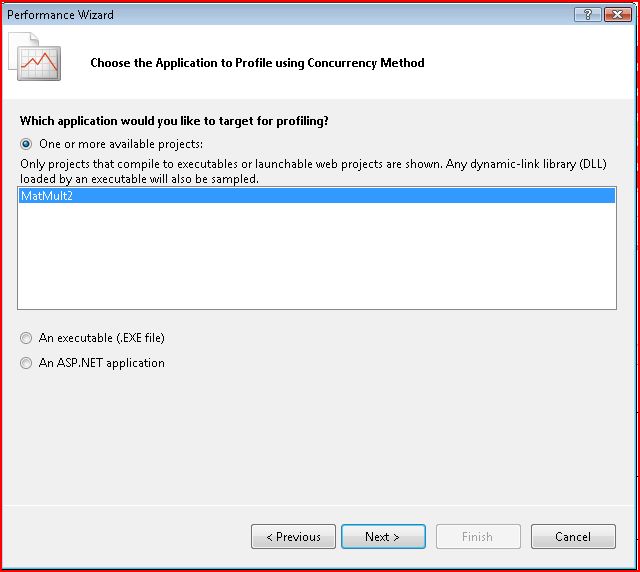
Since this is fine for my purposes, I just click "Next". Now, I'm presented with an option to launch the profiler at the end of the performance wizard. For this walkthrough, I'll assume that you chose the default, which is to launch the profiler:
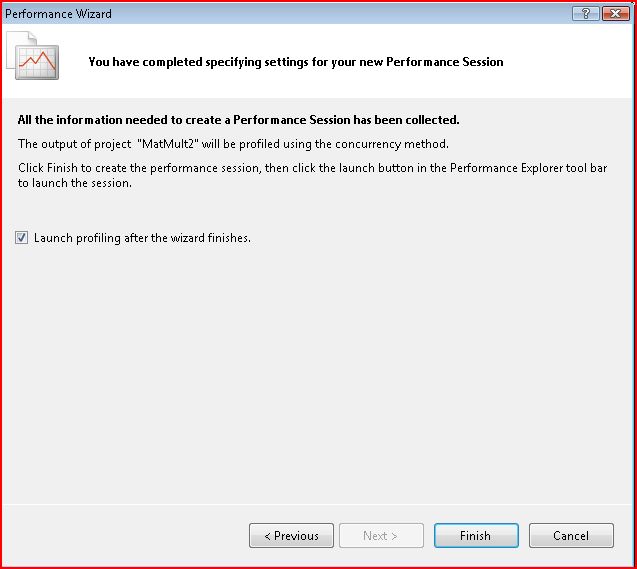
Click "Finish" and the profiler will launch your application and collect data. This should also bring up the "Performance Explorer" window in Visual Studio:
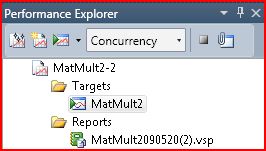
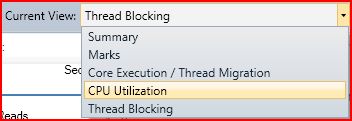
The performance wizard has created a "Performance Session" named "MatMult2-2" in this case, the default profiling method "Concurrency" is shown in the pull-down menu, my solution's executable is listed under the "Targets" folder, and a "Reports" folder is shown. There are multiple buttons on the explorer's toolbar. From left to right, these buttons are used to launch the Performance Wizard, create a new Performance Session, run a profiling session (using launch), stop profiler data collection, and then attach/detach if you'd like to profile a running application. In our walkthrough, collection will stop if you click the stop button (in the performance explorer window's toolbar) or when the process terminates (whether normally or by user action). Once data collection completes, the profiler will generate a profiling report with a .vsp extension and add it to the reports folder of the associated performance session. By default, the profiler will immediately open the profile report after collection completes. To access the views described in my previous post, you can choose the appropriate view from the "Current View" pulldown menu in the profile report toolbar:
Next, I will post some usage examples to illustrate how you may use our tool to understand and fix performance issues.
Enjoy!
Comments
Anonymous
June 02, 2009
PingBack from http://www.anith.com/?p=43915Anonymous
July 03, 2009
The comment has been removedAnonymous
July 03, 2009
Sergey, Thanks for bringing this up. Our tool only works on 32-bit and 64-bit versions of Windows Vista, Windows Server 2008, Windows 7, and Windows Server 2008 R2. If your application runs on these operating systems, you should still be able to do performance tuning there and usually see improvements on Windows XP.Anonymous
July 29, 2009
The comment has been removedAnonymous
July 29, 2009
Unfortunately, it is technically impossible for us to provide our tool's feature set on Windows XP. We would've really liked to do that.Anonymous
July 29, 2009
The comment has been removedAnonymous
July 30, 2009
John, Thanks for your email. There's a significant amount of work being done by our team to make it easier to express parallelism efficiently. You should definitely take a look at our Concurrency Runtime, Asynchronous Agents, and Parallel Pattern Library work for native code. For managed, you should take a look at the Task Parallel Library effort. We gave a series of talks at PDC2008 that should give you a very good idea about the new programming models and tools. The talks are archived at http://channel9.msdn.com/posts/pdc2008/tags/Parallelism/ and you should take some time to go over those. Also, you should use the VS2010 Beta 1 to familiarize yourself with the tools and programming models. If you want to start using these for production, in the past we have given a go live approval prior to release to market. For example, developers were able to use VS2005 Beta 2 to go live. I don't know what the plans are for VS2010, but you should keep this in mind when weighing your options. Let me know if you need more help.Anonymous
August 02, 2009
So, Hshafi, could you tell me you email so that I can get more help from you in the near future? My email is: zpf7879@126.com, please send one email to that. Thanks! JohnAnonymous
August 03, 2009
There's a good blog by Rick Molloy that'll provide you with better help with parallel programming in C/C++: http://www.parallelroads.com/blog I would suggest starting with Rick first. -HazimAnonymous
August 19, 2009
Hshafi, My application has a backend exe COM server. Now I want to perform concurrency profiling for it. But I found the Attach item is disabled. So Attach is not supported when performing concurrency profiling? What's the reason behind? For me, this exe cannot be launched directly. So we used to launch it from our other frondend application and then attach it and begin debugging or profiling. Now can we use the same procedure?Anonymous
August 24, 2009
Hi John, When you say that the attach item is disabled, are you saying that the button with the paper clip in the Performance Explorer window is disabled (see screenshot in the post). The attach scenario is really important and is supporting specifically to deal with situations such as yours. I believe that it was functional in Beta 1. Perhaps I need to elaborate on its usage?Anonymous
November 24, 2009
Hshafi, A long time since last post, :) I don't mean the button with the paper clip in the menu "ProfilerAttach/Detach". Instead, I mean when you right-click mouse in Performance Explorer on a Performance item, there is a "Attach/detach" menu in the pop-up menu. It is disabled. I don't know what the reason is. In addition, I didn't find the paper clip button in Performance Explorer. If you can elaborate such a topic, that would be very nice. :)Anonymous
December 02, 2009
Hi John, Apologies for not posting for a while; busy with Supercomputing and other deadlines. I'm working on something soon though. I just tried the context menu (right clicking) on the performance session item and Attach/Detach is enabled (I'm running Beta 2 Ultimate). I'll need more information to see if I can repro it on my end. The paperclip button often doesn't show up if the width of the Performance Explorer window is too narrow. You can either widen it or you can click on the tiny button in the top right corner (far right of the toolbar) of the window with the up/down arrows to see it. This is an annoying artifact when the toolbar items don't fit. I doubt that we'll fix this at this point of the development cycle. For attach to work properly, make sure that the current performance session is set up for the correct profiling option. Let me know if this helps. -Hazim