SQL Server 2014: Inside Hekaton Natively Compiled Stored Procedures
During the last period, I spent some time with several Microsoft ISVs around the world, talking and testing the amazing Hekaton new in-memory engine in SQL Server 2014. As often happens when a new technology appears on the stage, people do not fully understand all the implications and capabilities, and often concentrate only on a single item: that’s why persons I talked to, simply remembered that “Oh yes, Hekaton is fast since data is in memory! ”….. Well, this is true, obviously, but it’s only a part of the whole story. Just to land boots on
the ground for everyone, Hekaton is great for the three following reasons:
- Table data resides in memory: usage of algorithms that are optimized for accessing memory-resident data are used.
- No Locks or Latches: optimistic concurrency control that eliminates logical locks and physical latches.
- Native Code Compilation: tables and procedures are translated in “C” language and then compiled in assembly DLLs resulting in very efficient/fast code and reduced number of instructions to be executed.
For an excellent overview of Hekaton benefits and general principles, you can read the white-paper below, included in the CTP2 version of the SQL Server 2014 Product Guide:
SQL Server In-Memory OLTP Internals Overview for CTP2
In my blog post I want to put some lights on native code compilation for SQL Server Stored Procedures only, I will cover Tables in a future content. Then, just to effectively start, let me ask your opinion: why SQL Server team decided to compile Stored Procedure code,
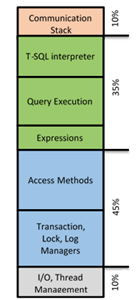
then “abandoning” interpreted TSQL? Trivial (and correct) answer is because it’s faster, but let me show you the diagram below, contained in a great recent post by SQL Server team:
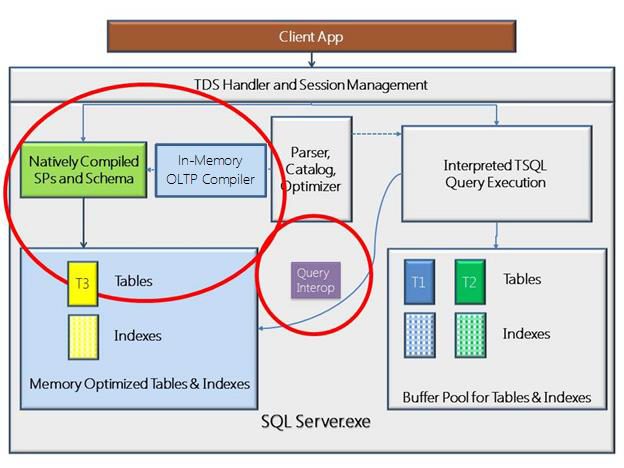
Architectural Overview of SQL Server 2014’s In-Memory OLTP Technology
This is a graphical representation of where time is spent, inside the SQL Server engine, when executing a Stored Procedure (green boxes = “relational engine”, blue boxes = “storage engine”): looking to the picture above is quite obvious that using compiled code, SQL Server will be more efficient since TSQL optimization, query execution, expression evaluations and access methods will be defined at compile time and will not require expensive processing using interpreted code anymore! Be aware that I’m not telling you that the SQL Server Parser, Algebrizer, and Query Optimizer components are not used anymore: they still play a key role in the Stored Procedure (SP) code generation, but they will be called into action only at creation time, not at execution time.
At stored procedure creation time, SQL Server 2014 compiler will convert interpreted T-SQL, query plans and expressions into native code: based on tables metadata, including indexes and statistics, all optimizations and plan choices are decided now, then an abstract representation of the Stored Procedure is generated and passed to “C” compiler and linker. There are several steps involved and artifacts generated, as you can see in the list and diagram below:
Hekaton: SQL Server's Memory-Optimized OLTP Engine
http://research.microsoft.com/pubs/193594/Hekaton%20-%20Sigmod2013%20final.pdf
- Based on TSQL Stored Procedure definition and tables metadata, MAT (Mixed Abstract Tree) is generated;
- MAT is then transformed into PIT (Pure Imperative Tree) where SQL-like data types are transformed into C-like data types (pointers, structs, arrays, etc.);
- PIT is then sourced to generate a “C” code text file which is written to the local file system, under SQL Server instance installation directories;
- “C” compiler (CL.EXE), distributed with SQL Server installation binaries and residing under “C:\Program Files\Microsoft SQL Server\MSSQL12.MSSQLSERVER\MSSQL\Binn\Xtp\VC\bin” (my default location), is invoked using the previous artifact as input, then will generate an OBJ file;
- “C” linker (LINK.EXE), in the same compiler location as mentioned above, is invoked and based on previous OBJ file will generate the final DLL that will contain the native compiled code to execute the original Stored Procedure.
Some more details on the points above:
- Compiled Stored Procedure DLLs, and related files, will be located in a “XTP” sub-folder under the main SQL Server data directory: here, another nested level of sub-folders will be created, one folder for each database using Hekaton, identified by Database ID.
- Several files will be produced for each Stored Procedure, as you can see in the picture below:
Based on the single stored procedure file set reported above, the naming convention used for file names uses:
- “xtp_p” to identify Hekaton Stored Procedures;
- “ _5” to identify the Database ID as reported in SQL Server SYS.DATABASES system table;
- “885578193” to identify the Stored Procedure Object ID as reported in SQL Server SYS.OBJECTS system table;
File extensions are used to determine which kind of file Hekaton native compilation process produced:
- “ *.c”: source code generated in “C” language;
- “ *.mat.xml”: XML file containing MAT representation;
- “ *.obj”: output from “C” compiler;
- “ *.pdb”: symbol file produced by the “C” compiler;
- “ *.out”: log messages generated by the “C” compiler (very useful for troubleshooting);
- “ *.dll”: assembly files generated by the “C” linker that will be loaded by SQL Server main process;
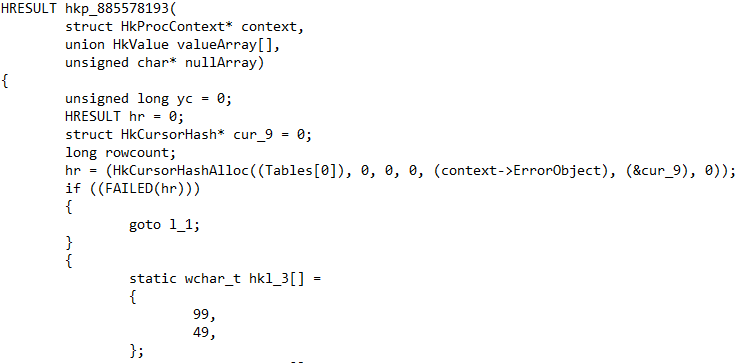
If you open one of the “ *.c” file, you will have confirmation that C++ is not used, only plain “C”, along with a bare metal “C” compiler (CL.EXE): if you ask why, as I did in the past, I can tell you that the it has been chosen since the generated code is more compact and efficient, no special C++ features is needed here, and finally there are very few files to include in the SQL Server installation binary set to be distributed.
- If you want to give a look to the parameters used for the compiler invocation, along with any warning or error message, you can open the “ *.out” file with Notepad:
- If you want to troubleshoot or give an insight into the compilation process, there is a trace flag available but not publicly documented, then the only way to obtain it is to open a Service Request to Microsoft Support. Anyway, for the only purpose of learning, below there is a sample extracted from SQL Server ERRORLOG after enabling the trace flag: it’s worth nothing that here you can understand how long each compile process step will take, very nice information to have in order to troubleshoot potential slowness problems.
If you want to speak about “internals”, you cannot avoid going depth into troubleshooting; this is where you may discover many interesting things, after playing extensively with Hekaton, here are some interesting points.
Database start-up
As I mentioned before, natively compiled stored procedures are recompiled at each in-memory database startup, but I discovered something un-expected, at least based on the official documentation: while in-memory tables are *all* immediately recompiled, before allowing data access, natively compiled stored procedures are only recompiled, and loaded into memory, only at first usage. If you want to check this fact, you can use Process Monitor tool from SYSINTERNALS (http://technet.microsoft.com/en-us/sysinternals/bb896645.aspx), as explained now. As you can see, when I brought my test database online, only a single DLL related to an in-memory table has been compiled and loaded in memory, nothing else relate to any stored procedure:
When I executed manually my single test stored procedure, this is what happened:
As you can see in the picture above, now my natively compiled stored procedure is loaded into SQL Server, and will stay there until you will stop the SQL Server instance, put offline the container database, or drop the stored procedure. As I explained before, when a natively compiled stored procedure needs to be compiled, SQL Server will invoke an external process, that is the “C” compiler (and then linker): if you remember from base SQL Server theory, when SQL Server invokes an external process, the calling worker thread will *actively* wait for completion, and cannot be interrupted (pre-empted). Finally, it is worth nothing that the smallest stored procedure you can write will have a minimum size of 72KB on disk and will use 96KB in memory (only for the image bits). For bigger and most complex stored procedures, it’s recommended to build a “warm-up” procedure that will invoke each module as soon as possible after database startup, in order to avoid long waits on code compilation.
Memory Dump
Since I used a pre-release version (CTP2) of SQL Server 2014, I encountered a couple of fatal exceptions for the main SQL Server process, then I noticed that inside the “ \LOG” SQL Server folder a new subfolder has been created as shown below:
The new folder is named “xtp_10_1_1” , where “10” is the Database ID where the exception happened, and inside it there is CAB file containing all the necessary files to diagnose the problem related to natively compiled stored procedure:
Natively Compiled Stored Procedure Lifecycle
A natively compiled stored procedure in Hekaton, will be loaded in memory when first created and, subsequently, at first usage after database start-up. Once in memory, it will stay loaded until the database will be taken offline or deleted since there is no way to purge. Additionally, as you probably already know, ALTER is not possible, you have to drop and re-create. Now, what happens if statistics on tables touched by the natively compiled stored procedure will change? If you expect a recompilation, you will be disappointed! At least in
CTP2, but I’m pretty sure also in RTM version, there is no automatic recompilation, new query plans will be only adopted when the in-memory database will be restarted or stored procedure re-created.
IMPORTANT: Regarding statistics on in-memory optimized tables, that have been introduced first in CPT2, please note that in Hekaton there is a requirement that they must be created with NORECOMPUTE and FULLSCAN options, as demonstrated by the following error message:
Msg 41346, Level 16, State 1, Line 334
CREATE and UPDATE STATISTICS for memory optimized tables requires the WITH FULLSCAN or RESAMPLE and the NORECOMPUTE options. The WHERE clause is not supported.
If you normally used SQL server plan cache to examine cached execution plans, be aware that natively compiled stored procedures are not here: they are pure DLLs, then cached by nature, but not reported under the typical “sys.dm_exec_cached_plans” DMV. If you want to have more details on your natively compiled stored procedures, you can use the following system view and DMV:
select * from sys.sql_modules where uses_native_compilation = 1
select * from sys.dm_os_loaded_modules where [description] = 'XTP Native DLL'
Based on my investigations, there is no Hekaton specific information into “sys.procedures” system view, then you will need to join it with the previous “sys.sql_modules”.
xEvents
Trying to search into the events collected by the default “system_health” session, I didn’t find anything useful related to natively compiled stored procedure, but when I searched over all the possible events, I discovered this interesting set:
In order to visualize this family of events, you have to select “Debug” value for “Channel” parameter and “xtp” for “Category”. The most interesting xEvents are listed below:
- xtp_create_procedure: Occurs at start of XTP procedure creation.
- natively_compiled_proc_execution_started: fired before a natively compiled procedure is executed.
There are some xEvents related to native compiled stored procedure query executions that will not be generated by default, see the next section on how to enable them; once enabled, “sp_statement_completed” event will be now generated, but “sp_statement_starting” will not.
Execution Statistics
By default, execution statistics is not enabled for natively compiled stored procedures, due to performance impact. You can enable manually in the following way:
- At the entire natively compiled stored procedure level, execute the command below:
exec sys.sp_xtp_control_proc_exec_stats 1
- To enable statistic collection at the statement level, inside any natively compiled stored procedure, execute the command below:
exec sys.sp_xtp_control_query_exec_stats 1
Once enabled, you can use traditional DMVs “sys.dm_exec_procedure_stats” and “sys.dm_exec_query_stats” to obtain and analyze execution statistics. Since there is non-trivial performance overhead, it’s recommended to disable execution statistics as soon as possible after
collecting data, also note that these settings will not survive to SQL Server instance restart. Regarding the information contained in the columns of the aforementioned DMVs, please note that:
- "sql_handle" and "plan_handle" values will be always equal to (0x0...0) since there is no plan in cache for natively compiled stored procedures.
- All values for columns related to logical/physical IO, either read or write, will be equal to (0), remember that we are in the context of in-memory stored procedure accessing table in-memory data only.
For more details on this topic, and query examples to work on the mentioned DMVs, please see the material contained at the link below:
Monitoring Performance of Natively Compiled Stored Procedures
http://msdn.microsoft.com/en-us/library/dn452282(v=sql.120).aspx
Execution Plans
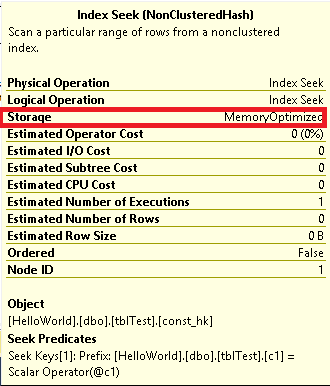
Since there is no plan in procedure cache for natively compiled stored procedures (they are DLLs!), there is only one way to look into the execution plan, which is using “set showplan_xml on” command or SSMS “Display Estimated Execution Plan”: if you try other options, like “Include Actual Execution Plan”, you will not obtain any data. For TSQL statements touching in-memory tables, this restriction does not apply.
Three interesting notes on the example above:
- “Storage” type is “MemoryOptimized”;
- “Estimated I/O Cost” is always equal to zero since it’s all in-memory data;
- Since this is an estimated plan, there is no information on actual numbers, query has been only evaluated, not executed;
Finally, a hidden gem you can see with your eyes if you open the natively compiled execution plan in XML format:
I have to confess that I was really surprised when encountered this for the first time: any query that will access in-memory table will use a serial execution plan with one single worker thread!
TEMPDB
Natively compiled stored procedure in SQL Server 2014 comes with a series of limitations, you can find the complete list at the link below:
Supported Constructs in Natively Compiled Stored Procedures
http://msdn.microsoft.com/en-us/library/dn452279(v=sql.120).aspx
My favorite one is that you cannot access/use disk-based tables; an immediate consequence is that you cannot create nor use TEMPDB tables, then you need a different mechanism, that is in-memory table types and variables as in the example below:
Using in-memory table types and variables is a nice and elegant solution; additionally this mechanism comes with a couple of important advantages over TEMPDB tables and variables:
- It’s really guaranteed that data will stay in memory, no spool on disk as may happens with TEMPDB objects;
- There is no more central resource bottleneck on the unique TEMPDB database resource, now you can have your “temporary” (and in-memory) storage inside each user database;
When you create a TYPE for an in-memory table, something interesting happens: as per normal in-memory tables, it will be natively compiled and files generated, but this time the file names used are a bit different, “xtp_v” ( “v” = variable? ) prefix is now used, as you can see below:
NOTE: If you use SYS.TYPES to look into object metadata, there is nothing indicating that is in-memory.
If you open the “ *.mat.xml” file, you can see some interesting properties:
IMPORTANT: Please remember that having at least one index is a requirement for in-memory tables, but having a primary key (PK) is a requirement only for durable tables.
The highlighted properties indicates that the object is a table type and is “NonDurable”, pretty obvious. What is not obvious is that it seems there is a primary key on the second column (ProductID) as indicated by “PrimaryKey="2" ”, and an identity on the fourth column (LocalID) as indicated by “IdentityColumn="4" ”, but I never defined any primary key or identity: at this point, I can only argue that since this is an internal representation, these terms may not mean what we are guessing, I will eventually post new details when and if I will
find an explanation. Additional details at the link below:
SQL Server 2014 In Memory OLTP: Memory-Optimized Table Types and Table Variables
Native Compilation Advisor
There is a very nice tool in SQL Server 2014 that can make your stored procedure code migration to Hekaton easier, it is called “Native Compilation Advisor” and you can read about details at the following link:
Native Compilation Advisor
http://msdn.microsoft.com/en-us/library/dn358355(v=sql.120).aspx
This tool is part of a broader family that includes:
- “Memory Optimization Advisor”: is the counterpart of “Native Compilation Advisor” for tables.
Memory Optimization Advisor
http://msdn.microsoft.com/en-us/library/dn284308(v=sql.120).aspx
- “Analysis, Migrate and Report” (AMR): this tool should be used before all the others in order to determine which tables and procedures to migrate.
AMR (Analysis, Migrate and Report) Tool
http://msdn.microsoft.com/en-us/library/dn205133(v=sql.120).aspx
Once you have determined which stored procedures to migrate to natively compiled in Hekaton, using the AMR tool, you can analyze one by one using the context menu item available inside SQL Server Management Studio:
Tool usage is absolutely straightforward and it will report any incompatibility in the source code violating Hekaton requirements:
You can review all natively compiled stored procedure limitations, supported parts, tool information, recommendations and migration guides at the link below:
Introduction to Natively Compiled Stored Procedures**
http://msdn.microsoft.com/en-us/library/dn133184(v=sql.120).aspx
That’s all folks…. Stay tuned for future blog posts on SQL Server 2014 In-Memory Tables and Query Processor internals.
Comments
Anonymous
March 13, 2014
SQL 2014 is going to be a perf monster!!! Nothing like simple elegant 'C' to get blistering perf! Great article! Thank you.Anonymous
May 23, 2014
Can any one point me to changes made in SQL 2014 RTM compared to SQL 2014 CTP2 ?Anonymous
June 04, 2014
Aravind, unfortunately I'm not aware of any table/content reporting this kind of information. Regards.Anonymous
August 17, 2014
This was an extremely helpful article. Thanks.Anonymous
December 15, 2014
Great article, check this great guide on identifying manually update-able stats: sqlturbo.com/finding-good-stats-candidates-for-manual-updatingAnonymous
October 12, 2015
C, written as a joke, used to create Space Wars and the fore runner of UNIX and UNIX itself... Now it is the underlying technology of everything. Thank you Dennis and Brian. You guys are great!Anonymous
February 23, 2017
Awsome, now we will have the much wanted classes and closured/lambda expressions in T-SQL and have them generated to C, for example:CREATE PROCEDURE proc_with_classAS BEGIN -- using classes Class FirstClass VAR Member1 VARCHAR(256) End Class DECLARE obj FirstClass SET obj.Member1 = 'any value' print obj.Member1 -- will output 'any value' -- using closures/lamda expressions DECLARE @variable VARCHAR(256) = EXEC BEGIN CLOSURE() RETURN 'value returning from closure' END CLOSURE print @variable -- will ouput 'value returning from closure' ENDGoNot difficult for some to add this to to the T-SQL parser in Microsoft, is it?


