PAWs and Attack Graphs
In 2015 John Lambert penned a fantastic article on the concept of attack graphs – if you haven’t read it, I highly encourage you to do so. I recommend it to all of my customers as a way of illustrating one of the most important concepts in cyber defense – that of relationships. Broadly speaking, a computing environment exists to serve the purposes of the end users, and as long as they can achieve their primary business functions, they’re (usually) happy and tend to leave it at that. However, attackers aren’t concerned with what they’re supposed to do, they care about what they can do. That’s where the relationships come in – if an attacker determines that Workstation A can connect to Workstation B, which has a direct administrative connection to Server C, then the attacker will take advantage of that connection … even if the end users of Workstations A and B have no interest in that connection. End users – and security professionals – often miss or outright ignore these relationships, much to their cost in the event of a breach.
While every organization should strongly consider limiting the connectivity between workstations (lateral traversal), it’s not an overnight job – it takes planning and effort to fully accomplish. However, you can gain “big wins” by carefully deploying Privileged Access Workstations (PAWs) to “break” the attack graph.
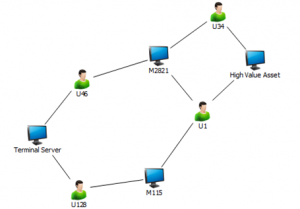
The sample graph image below comes from John’s blog article that I referenced above. I’ll use it to illustrate the way you can use an attack graph to selectively deploy PAWs for immediate security wins.
In this example, the attacker’s goal is the High Value Asset in the top right. The attacker has compromised an end user workstation and has parlayed that access into the further compromise of the Terminal Server at bottom left. Using relationship graphing software, the defenders have determined that the users U46 and U128 have access to workstations which are shared by U34 and U1, both of whom ultimately have access to the High Value Asset (HVA)
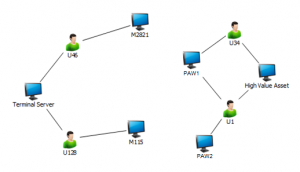
Securing the HVA involves more than simply hardening that workstation further – it means breaking the graph by limiting where intersections occur. An intersection occurs when two or more accounts have access to the same resource – for example, M115 and M2821 are both intersections, because multiple end users log onto both. They’re really important intersections, too, because U1 and U34 have access to the HVA, and through their shared access to M115 and M2821, an attacker can work his or her way to that HVA. At this point, the attack graph has essentially become a roadmap for the attacker – but also for the defender. By identifying those critical users (U1 and U34), the defender can work with them to ensure that they only access the HVA using Privileged Access Workstations (PAWs). If we limit U1 and U34 to PAWs, then we’ve essentially severed the link between the Terminal Server and the HVA – there are no lines leading from the left half to the right half of the drawing below.
This is really the essence of employing an attack graph in a defensive role – you learn about the relationships between objects which allow an attacker to move laterally in your environment, and once you’ve identified the key intersections, you then “remove” them. In this case, you remove an intersection by ensuring that the accounts with access to the HVAs only use specific systems for that access. It’s important to note that while PAWs were initially envisioned as protections for administrative access (as in, Active Directory administration), they’re equally valuable for protecting access to business HVAs like intellectual property, customer data, and financial records. Not everyone in an organization needs to use a PAW, but if you’re concerned with protecting your most precious digital possessions, consider deploying PAWs to secure their access.

