IE8 Script Debugger - Under the Hood
IE8 Beta1 (download available here) now includes a Script debugger that is part of IE8 Developer Tools. This Script debugger was built by the JScript team and I hope you have been using it to fix all script errors when building your web applications.
In this post I will be discuss the design of the script debugger.
The debugger is designed with Active Debugging Framework (more information here). Here is the block diagram of how debugger looks.
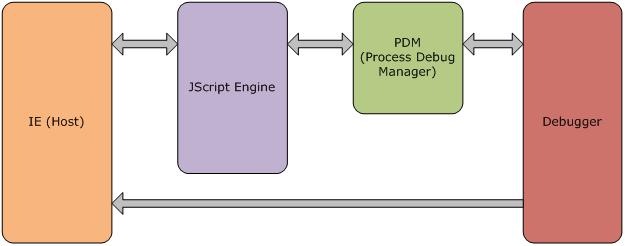
A brief description about the different components in the above block diagram:
IE – the host controls the JScript engine by providing the script code and other objects that are needed to execute that code.
The JScript engine is responsible for parsing and executing script code and handling other debugger related operations like stack enumeration, expression evaluation, variable inspection, and both parsing-time and runtime error notifications. The JScript engine interacts with the IE to resolve the external references to named objects (eg. window or document), it also notifies host about execution errors and script state changes.
The Process Debug Manager (PDM) manages various process related information (where is the process running, thread information, parent-child relationship among threads-processes etc.) and also co-ordinates the interaction between all components like engine, debugger, host etc.
Debugger is the component that implements the UI and other functionality that normally comes to our mind with word script debugger.
When we started work on the design for a script debugger for IE8 Developer Tools, the first decision was whether the debugger would be residing in the same process or in a different process. Since the primary reason for building a debugger that is available with IE8 Developer Tools was to provide an integrated debugging experience, we decided to go down the path of building an in-process debugger. Also, having the script debugger in the same process would result in better integration with the host since the debugger will have direct access to host events like say page load and there would be fewer COM calls required to interact with the host or engine.
As soon as we went down this path of having the script debugger in the same process, we hit a fundamental issue, which was that the JScript engine is loaded by the IE UI (rendering engine) thread. What this meant was that when a breakpoint is hit, the UI thread would halt and the script debugger wouldn’t even be displayed. To address this issue, we designed the debugger so that the UI of the debugger would be on a different thread than the script engine.
But with this choice we now had to address the issue of interaction of the debugger with PDM, since this component expects the debugger to be on the same thread. So we split the debugger into two components. The first one, the UI component, renders the debugger application and runs as a separate thread. And the second one, the core or worker component interacts with PDM and host to provide data to the UI component for rendering, and runs on IE’s UI thread.
I hope this blog post explains some of the design decisions of the script debugger of the IE8 Developer Tools and the impact on the functionality of the script debugger.
So how have you been using the script debugger to improve your productivity? We would love to hear from you on your experiences using the script debugger and would also like to know what features you find the most useful.
Sheetal Kamat, SDE, JScript.
Comments
Anonymous
March 17, 2008
I have posted about the JScript Debugger Design for IE8 Developers Tools on the JScript Team blog ( hereAnonymous
March 18, 2008
Debugging eval code is problematic, not all the code shows up once selected from the dropdown in the script tab. Also, the selected document in the dropdown does not reflect dynamically loaded documents (document.createElement("script")).Anonymous
March 18, 2008
I used the script debugger today to debug some DHTML (UI) code. It was a life saver. Just one thing I did not like was that when the debugger is active on break point I could not switch to the browser to see the UI. For the rest the debugger is quite good.Anonymous
April 07, 2008
Looks like it could be very helpful. My major beef: the script file selection window has an unmanageable number of script files, all with the non-descriptive name, 'eval code'. I figure that this has somehting to do with the design of IE, but is there anyway to put the file names instead of the 'eval code'? Otherwise, if I have 100s of script files, it is next to impossible to find which one I would like to set a breakpoint at.Anonymous
December 29, 2008
Thank goodness. Even when applications I write work in all of the other browsers, IE always has some little problem that I always have great difficulty tracking down because of the lack of a script debugger.Anonymous
February 18, 2009
Please provide a way to give an artificial file name to eval code. Javascript packaging frameworks use eval to load javascript files through XHR, and when I view the javascript documents through the debugger, I see 100's of 'eval code' files. Its almost impossible to set breakpoints.Anonymous
March 26, 2009
Is it possible to use the internal debugger using the "debugger;" command? When IE hits a "debugger" statement, it opens a window asing me to start Visual Studio. If I deny, it continues and does not use the internal debugger!