JScript Debugger in Internet Explorer 8
As Shreesh mentioned in his blog, Internet Explorer 8 has a built-in JScript debugger. With Internet Explorer Developer Tools you get a light weight JScript debugger that is well integrated in the browser and available out of the box. This is an in-proc debugger making sure that you don’t have to launch a separate app. It has familiar Visual Studio feel and features like call stacks, watches, locals and immediate window.
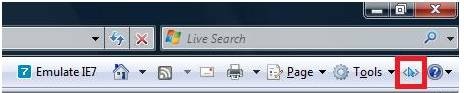
To get to the debugger just press SHIFT+F12, or click the developer tools icon in the command bar. After launching the Developer Tools, switch to the script tab.
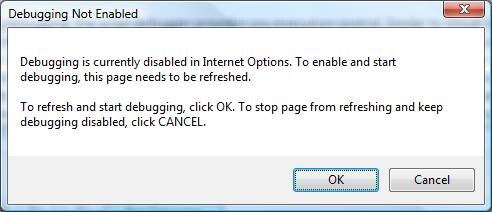
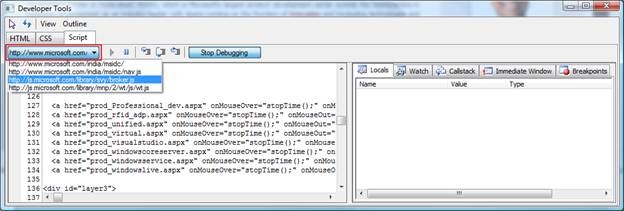
Before starting debugging you can browse the source code of the websites’ main page and also use immediate window to try out JScript code. You can start the debugger session by clicking on the ‘Start Debugging’ button. The debugger lets you debug even when debugging is disabled in Internet Options Control Panel. This will allow you to enable debugging only for the IE instance you are debugging. All other IE instances will still be in non-debug mode making sure that you don’t get script error dialogs. This will also make sure that debugging won’t have any performance hit on IE instances other than the one being debugged. Debugger will refresh the web page with your consent, in case debugging was previously disabled. If you want to avoid page refresh, you can enable debugging from Internet Options.
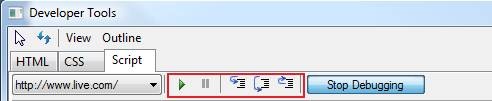
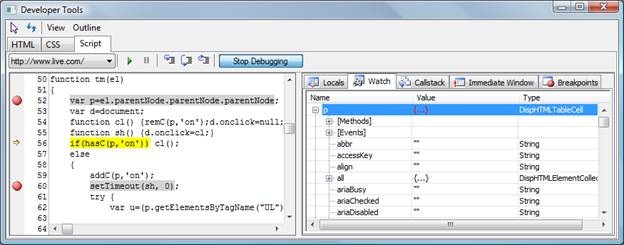
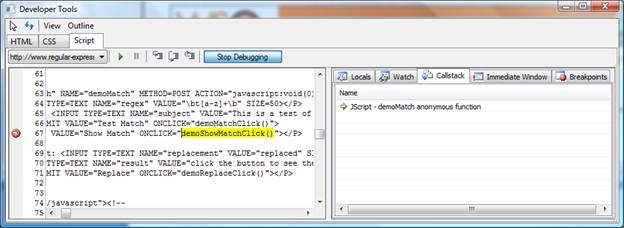
After starting debugging, the script debugger provides you execution control. Similar to Visual Studio you can set breakpoints by clicking in the source viewer next to the line number. You can also use context menu or keyboard shortcut (F9) to set breakpoints on the script statement at the cursor location in source viewer. If you have multiple script statements in a line of code, you can set multiple breakpoints on that line and they will be hit based on script statement. In case you want to break execution at first script statement, debugger provides a Break All button in the toolbar.

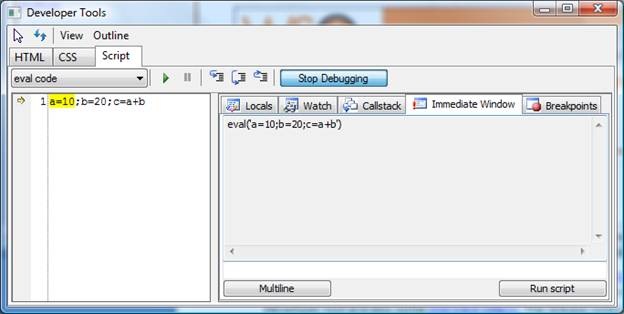
You can also browse the included files and eval() code using the source explorer drop down list.
While debugging, debugger will also break on script runtime error locations. Debugger will only highlight the script statement that will be executed. On a breakpoint debugger provides you Visual Studio like options to control the execution. You can use following commands to control the execution:
- Step Into: Executes the next statement of script and pauses, even if the next statement is inside a new method. You can either use toolbar button or keyboard shortcut F11.
- Step Over: Executes the next statement of script, continues until the next line of script in the current method, and then pauses. You can either use toolbar button or keyboard shortcut F8.
- Step Out: Continues executing script until the next statement in the method that called the current method. You can either use toolbar button or keyboard shortcut SHIFT+F11.
- Continue: Continue running script without pausing until hitting another breakpoint (if any are set). You can either use toolbar button or keyboard shortcut F5.
At breakpoints you can navigate call stack and inspect local variables. All this functionality is provided in the right hand side tabs of the debugger. Let’s just take a look at each of these tabs –
Locals – This tab displays the name, value, and type of all variables available in the current execution scope. Just like Visual Studio, you can drill down in objects hierarchies and change the value of variables. When you step in or step out the variables which have been modified will be indicated with value in red color.
Watch – Watches are user defined variables or expressions to be watched at each halt of script execution. Like locals you can drill down object hierarchies, change values and observe values changed during stepping through code. Watches can be added either by typing a variable name or expression into the watch window or through context menu available in source view.
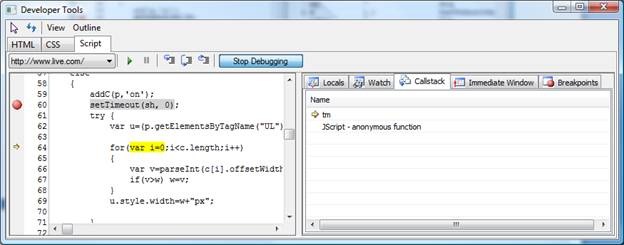
Call Stack – Whenever the execution is paused at a breakpoint call stack tab will let you transverse the stack and inspect the variables at that execution context. Double clicking on the stack entry will take you to the location in source code.
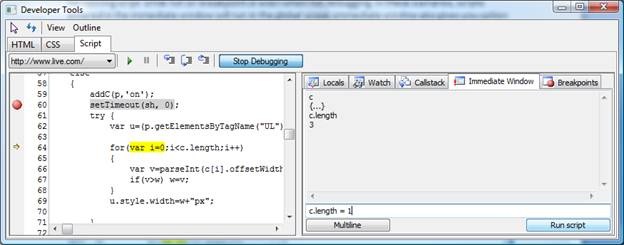
Immediate Window – Immediate window can be used to run scripts at the runtime. While on a breakpoint the script will be run in the current execution context. You can also use immediate window for running script while not on breakpoint or even when not debugging. In these scenarios, scripts entered in the immediate window will run in the global scope. Immediate window also gives you option to provide multiline script block by expanding the input window. This can be done using the ‘Multiline’ button. You can go back to the single line input by clicking on the ‘Single Line mode’ button.
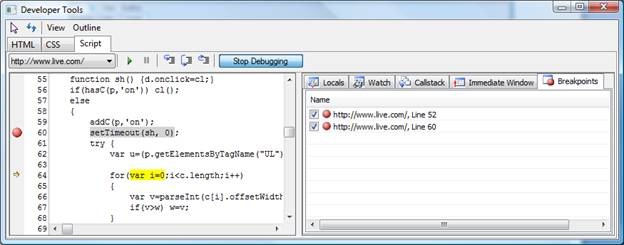
Breakpoint – This tab displays all the breakpoints currently set. You can enable/disable breakpoints by using the check box or the context menu. You can also remove breakpoints using the context menu. Double clicking on the breakpoint will take you to the source code. Breakpoints are maintained until IE8 Developers Tools is closed.
This debugger has inbuilt support to debug eval() code and event handlers. You don’t need to enable any options to debug them.
More details on the debugger are available in the Developer Tools Whitepaper. We will also have some debugger videos up very soon. Keep checking this blog. John from IE team has a blog entry describing the Developer tool and also some overview videos. The release notes are available here.
We would love to hear back from you about this debugger. Let us know how this debugger has helped you and also any issue you might have encountered.
Thanks and happy debugging!
Deepak Jain
Program Manager
JScript Team
Comments
Anonymous
March 12, 2008
If you have ever struggled to debug a JScript bug in Internet Explorer, you have a new friend – DeveloperAnonymous
March 13, 2008
You've been kicked (a good thing) - Trackback from DotNetKicks.comAnonymous
March 13, 2008
so cool!Anonymous
March 13, 2008
Too goodAnonymous
March 13, 2008
Would love to try the new JScript Debugger, but, like the IE7 version with it simply does not work. On my genuine Vista Business PC IE7 always locked up whenever it the Internet Options for Script Debugging was turned on. While disabled by default on my PC, turning debugging on for this instance causes even the simplest page to lock up when trying to refresh. This does look like a nice Developer Tool, I just wish I could actually use it. So far I've only been able to get the script debugging to work on the MS provided XPSP2 VM with IE6. =/ Any chance that the Developer window can have the sections on the right be broken out to use their own window? Keep it the way it is by default, but for those of us with multiple monitors this is handy.Anonymous
March 13, 2008
With an ajax call, try getting a complex JSON object or even a simple file containing a function of about 300 lines, eval it, select one of the "eval code" items in the dropdown of the script tab. You will notice that the code is truncated, and as well, you can not place break points, etc. I find this extremely debilitating. Seeing code is different from debugging it, and in this case, i can't even see all the code. Also, scripts which are added dynamically are not discovered in the Developer Tool's script tab.Anonymous
March 13, 2008
The comment has been removedAnonymous
March 13, 2008
Just one comment, it took you 10 days to do this post. Someone from Visual Studio team blogged about their experience on the same day. Please look at http://blogs.msdn.com/webdevtools/archive/2008/03/05/jscript-debugging-made-easy-with-ie8.aspx. I keep saying learn from Visual Studio. Can someone also tell me the future plans?Anonymous
March 13, 2008
The comment has been removedAnonymous
March 14, 2008
The comment has been removedAnonymous
March 14, 2008
The comment has been removedAnonymous
March 25, 2008
<quote>11. This is a limitation as each eval/anonymous code is treated as a new code block by the script engine, but we are working at making it better</quote> You may be underestimating the importance of debugging dynamic code, especially because we are working with a dynamic language.Anonymous
September 17, 2008
In Internet Explorer 8 Beta 2 JScript team has focused on improving developer productivity. You can readAnonymous
March 24, 2009
During Beta1 and Beta2 pre-releases of IE8, we’ve blogged about the performance optimizations done inAnonymous
March 24, 2009
During Beta1 and Beta2 pre-releases of IE8, we’ve blogged about the performance optimizations done inAnonymous
May 18, 2009
Ie8 still has problems,especially with the javasciptsAnonymous
August 31, 2009
Hi, I'm working at a greasemonkey script and now I want to make it available on IE. I'm interested if there is a way to put my debugging data into javascript console (in FireFox there is console.log , in Opera there is window.opera.postError). So there is something like this? If not maybe you would like to implement it because as a web developer I need easy debug tools.Anonymous
March 07, 2010
It is really an excellet tool for javaScript debugger.Anonymous
March 18, 2010
As a very occasional user of web dev stuff I have found this capability a wonderful thing. Thank you. You should see some of the stuff out there on offer - unusable is the word Eric! Takes forever to set up a debug session when all you have is a 100 lines of java to play around with. Thanks again, I was just about to give up on j script and do it terminally boring HTML when I came accross this 'ere blog.Anonymous
April 22, 2010
I really need to debug IE - debug code is one thing, debug code in IE is a completely different thing - and really hope some moron on Microsoft will someday learn what 'standards' mean.Anonymous
August 29, 2010
The comment has been removedAnonymous
November 22, 2010
The comment has been removedAnonymous
November 22, 2010
Wow, finally figured it out. Apparently the button on the command bar and the button in the tools drop down (SAME ICON BTW) have completely different functions. Way to go Microsoft...Anonymous
February 16, 2011
The comment has been removedAnonymous
February 28, 2011
A bad debugger for a bad browser...Anonymous
June 01, 2011
The Javascript that is displayed in my version of IE8 Developer Tool is minimized. This makes debugging almost impossible. How to fix?Anonymous
August 23, 2011
I made a video tutorial on how to remove developers menu from internet explorer... just in case vid4.us/.../internet-explorer-how-to-disable-developer-tools-menuAnonymous
September 29, 2011
Thanks for your support..i am very new to java script programming ..this link helps me how to debug the code....Anonymous
February 10, 2012
Developers of IE are so generous!! First they produce terrible JS engine. And now they even let us find, what JS commands they (Microsoft Developers) DON'T WISH to include in their browser. I love it so much! Especially when we have to charge customers for extra hours wasted on debugging javascript in IE and persuasion to switch on Firefox or Chrome.