The Case of the Random IE and WMP Crashes
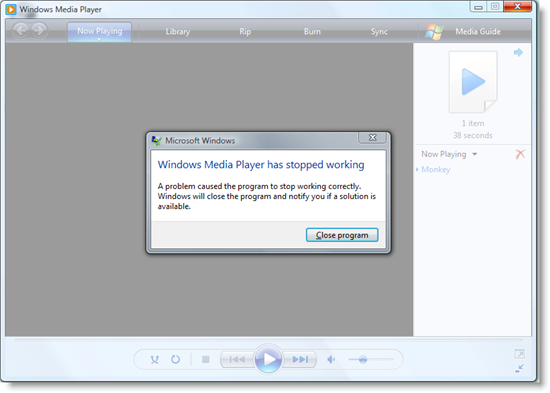
When I experienced a crash in Internet Explorer (IE) on my home 64-bit gaming system one day, I chalked it up to random third-party plug-in memory corruption. I moved on, but a few days later had another crash in IE. Then, Windows Media Player (WMP) started crashing every third or fourth time I used it:
Crashes in different programs seemed to point at a more fundamental problem. I had over-clocked the CPU, so I speculated that the rash of crashes were a side-effect of CPU overheating and reluctantly dialed back the clock multiplier to the factory specification. To my dismay, however, the crashes continued. My next theory was that I had bad RAM, but the Windows Vista Memory Diagnostic failed to identify any problems.
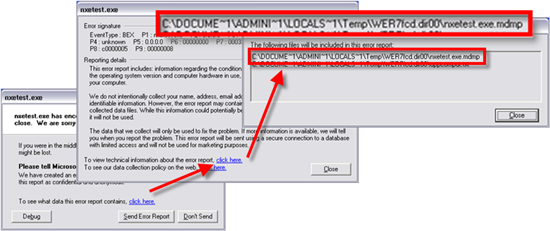
Hardware problems seemingly cleared, my next move was to look at the process crash dumps to see if they held any clues. But first I had to find a crash dump to look at. Windows XP’s Application Error Reporting process always generates a dump before showing you the application crash dialog, and you can find the location of the dump by clicking to see the report details and then viewing the report’s technical information:
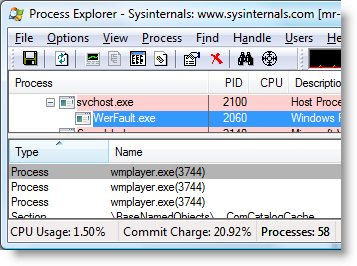
Windows Vista’s corresponding dialog doesn’t offer a way to get at a report’s technical information and it doesn’t generate a dump unless Microsoft’s Windows Error Reporting (WER) servers request it, which they only do for crashes reported in high volumes. Fortunately, WerFault, the process that presents the dialog, keeps the crashed process around until you press the Close Program button, which offers an opportunity to attach to the process with a debugger and examine it. You can see WerFault’s handle to a crashed Windows Media Player process in Process Explorer:
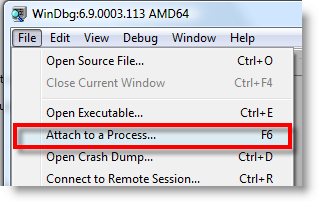
The next time I had a crash, I launched WinDbg, the Windows Debugger from the Debugging Tools for Windows package that’s available for free download from Microsoft. After making sure that I had the symbol configuration set to point at the Microsoft public symbol server (e.g. srv*c:\symbols*https://msdl.microsoft.com/download/symbols) in the Symbol File Path dialog, I went to the File menu and selected the “Attach to a Process...” menu entry:
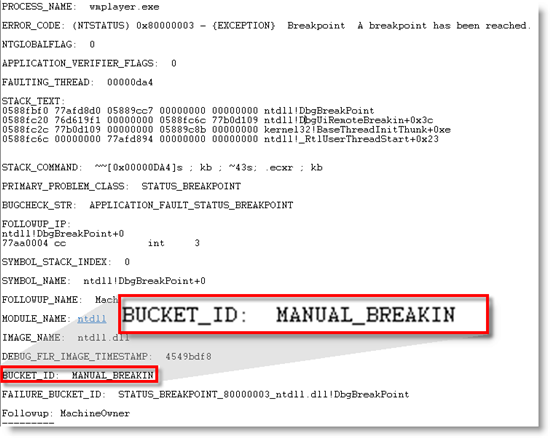
That opens the WinDbg process selection dialog, which I scrolled through to find the crashed process. When I selected the process, WinDbg opened it and presented the same interface it does when it loads a crash dump, except that when you load a crash dump, you can execute the !analyze debugger command that uses heuristics to try and pinpoint the cause of the crash; when you perform a debugger attach, an analysis will just tell you what you already know, that you attached with a debugger:
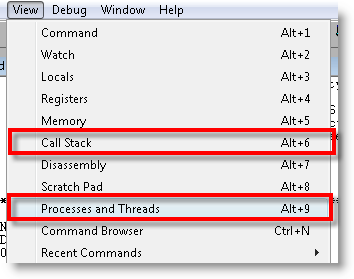
Looking for a potential cause of a crash when attached requires looking at the stack of each thread in the process, so I opened the Processes and Threads and Call Stack dialogs in the View menu:
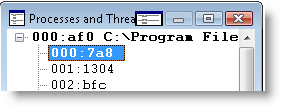
I started examining threads by selecting the first entry in the threads dialog:
The WinDbg command window usually grays and says “Busy” as WinDbg pulls symbols from the symbol server, after which the call stack dialog populates with the function nesting of the selected thread at the time of the crash. I examined each thread’s stack in turn, moving between threads by pressing the down arrow and then the enter key, hunting for a stack that had function names with the words “exception” or “fault” in them. Near the end of the list I came across this one:
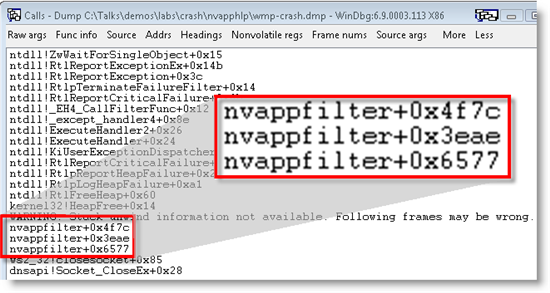
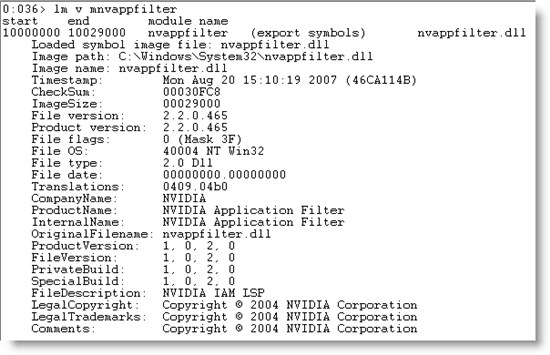
I noticed that the top of the list is full of functions with “Exception” in their names. Looking down the list (up the stack), I saw that a function in Nvappfilter called Kernel32.dll’s HeapFree function, leading to the crash. The exception in the heap’s free routines meant that either the caller passed a bogus heap address or that the heap was already corrupted when the function executed. If a Windows DLL had been the caller I would have suspected the latter, but in this case the caller was a third-party DLL, which I could tell by the fact that WinDbg couldn’t locate symbol information for it and hence didn’t know the names of the functions within it. I confirmed that by issuing the lm (list module) command to look at its version information:
Nvappfilter was now my primary suspect, but I didn’t have direct evidence that it was responsible. I continued to use the system and followed the same debugging steps on the next several crashes. Whether it was IE, WMP or a game, the faulting stack was always the same, with Nvappfilter calling HeapFree. That’s still not conclusive proof, but the anecdotal evidence was pretty compelling.
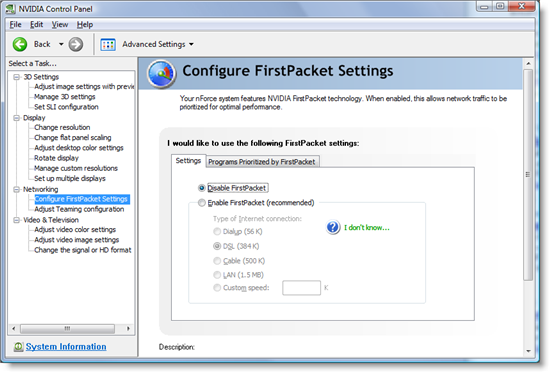
At that point I went to see if there were updates for Nvappfilter, but I wasn’t sure what software package it was associated with. I entered its name in a Web search and discovered that it’s part of the nVidia’s FirstPacket feature that prioritizes game traffic and that’s included in the nForce motherboard’s software:
I went to nVidia’s site and downloaded the most recent nForce driver package, but it failed to update Nvappfilter.dll and I continued to have the crashes.
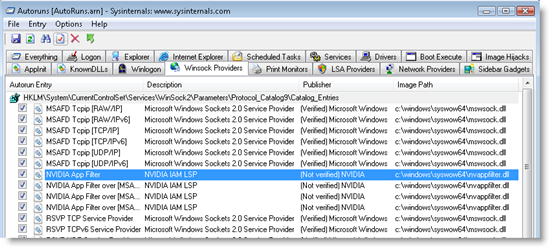
The nVidia control panel offers no way that I could find to prevent Nvappfilter from loading, so my only recourse was to manually disable it. I wasn’t using the FirstPacket feature, which I had previously been unaware of, so I wouldn’t miss it, but first I had to figure out how it configured Windows to load it. For that I turned to Autoruns, where I found references to Nvappfilter’s 32-bit and 64-bit versions in the Winsock Layered Service Provider (LSP) section:
I deleted all of Nvappfilter’s entries, rebooted the system and have been crash-free since. While I was writing this post, I checked again for nForce software updates to see if Nvappfilter had been updated. The latest version doesn’t look like it includes Nvappfilter or any other Winsock LSP, so assuming Nvappfilter was at fault, it’s no longer an issue.
One other thing I’ve done since I investigated these crashes is take advantage of Vista SP1’s “local dumps” functionality so that I'll automatically get a crash dump to investigate for any application crash I experience. If you create a key named HKLM\Software\Microsoft\Windows\Windows Error Reporting\LocalDumps, WerFault will always save a dump. Crashes go by default into %LOCALAPPDATA%\Crashdumps, but you can override that with a Registry value and also specify a limit on the number of crashes WerFault will keep.
Comments
Anonymous
January 01, 2003
The comment has been removedAnonymous
January 01, 2003
Mark, This is my first reading from you and it was extremely interesting. I like the others in this blog found it to be very informational. I have my own part time PC repair company and I also build web pages and configure software. The information you placed in this article though was a little beyond me. I have to admit, I know allot about computers and I do think I am fairly knowledgable on most of what I do but I am still learning and I am not afraid to admit I do not know everything. I like others should always be willing to learn and today I did learn from this article. It was very informative. I have been for some time trying to figure some of the issues with IE's crash problems. Again, thank you and I do look forward to many more articles much as this one. The only and again I say the only issue I have is the steps you have to take to resolve the crash issue in IE is geared more torward someone who has tech experiance, not your average home user. Most home users are not going to understand the process of going through debugging nor setting up new registry settings. But again, great blog article. Thank you it helped me and Im sure many others.Anonymous
January 01, 2003
Simila on my Laptop with Nvidia Graphics GeForce 8400M G drivers.Anonymous
January 01, 2003
Joel Peterson: I like first-person shooters, both single and multiplayer, but prefer multiplayer. I've been an addict of the Battle Field series starting with 1942, then Vietnam, 2 and now 2142.Anonymous
January 01, 2003
The focus of Vista is to troubleshoot on your behalf. That's where WerFault comes in: crashes affecting many users get human attention and solutions are sent back to the user where they show up in Problem Reports and Solutions and in fixes sent back through Windows Update. This blog isn't aimed at the average user, but at the people that read it. I hope that the techniques I show, which I believe are accessible to those that find the sysinternals tools accessible, help you troubleshoot your personal systems and any systems you manage.Anonymous
January 01, 2003
Mark, This is one of those articles I have returned-to several times. Great information! I have followed your work at Sysinternals and now Microsoft and am continually amazed. Thank you for sharing your knowledge!Anonymous
January 01, 2003
I just installed Vista Ultimate (32 bit including SP1) onto a new, fresh disk (with Home Premium running on the other hard disk) and immediately, with absolutely no other software installed at all, IE immediately crashed every time I used it. After installing Office, Outlook also crashed, just disappearing from the screen after a few seconds. Then the blue screen of death appeared - not seen on any of my machines for a couple of years now. I have spent three days trying to get a stable copy of Vista Ultimate running on this machine. It seems to be impossible. Troubleshooting hints such as this make it seem as though it's a single problem, but clearly the build is just rotten. I feel severely let down by Microsoft, having always championed them against the rest. I had to use Firefox just to be able to download patches, and to read this blog!Anonymous
June 02, 2008
The comment has been removedAnonymous
June 03, 2008
Is it just me, or does it seem inordinately difficult to track down such things? I've been a Windows developer since 1989, so I'm not exactly a novice, but I don't have the kind of familiarity with WinDbg necessary to find such things. And I doubt all that many other developers do either.Anonymous
June 03, 2008
Might be a leftover from the onboard firewall feature that they (Nvidia) never got working right.Anonymous
June 03, 2008
I wasn't really surprised that it was an Nvidia driver that caused this. I have had similar problems with their RAID drivers of the nForce motherboards. Now I always check with uninstalling nForce features for strange behaviours. When will Nvidia ever learn how to write good drivers?? I guess never, but they should stick to writing drivers to GPUs...hey wait a moment, they cannot do that either ;-)Anonymous
June 03, 2008
Hello Mark! Thank you for your post - it's great, becourse it was show cause of my problem, but what is better - it shows way, how to identify cause of problem and how to find solution. Thank you! Vladimir (Czech Republic)Anonymous
June 03, 2008
The comment has been removedAnonymous
June 03, 2008
This is obviously below your actual experience, which is exactly why I think it's very cool that you provide intro posts, with meticulous step-by-step instructions. Posts like this will hopefully help a beginner realize he can do it too.Anonymous
June 03, 2008
Hi Mark, I enjoy your work very much and I appreciate your efforts to write about debugging. Showing how to debug step by step combined with what you are thinking, what are your guesses and thoughts about it, all this is very useful and shows how great things are done. I am looking forward for the next version of Windows Internals book coming this year. You are doing a great job !Anonymous
June 03, 2008
As several comments have said, the skills required to do this kind of investigation are not very common (except maybe among people who read this kind of blog :-). This skills gap is likely to get worse because Vista makes such debugging that bit harder: as Mark's post says: "Windows Vista’s corresponding dialog doesn’t offer a way to get at a report’s technical information and it doesn’t generate a dump unless Microsoft’s Windows Error Reporting (WER) servers request it..." Surely it would be better if the OWNER of the machine could control whether these dumps are kept, rather than WER deciding for them.Anonymous
June 03, 2008
For those who want Vista to magically figure the problem out for you, it should be noted that even with a debugger and full access to the entire machine at the instant of the fault - one couldn't say for sure what the problem was. And just because disabling nvappfilter stopped the errors, doesn't mean it's to blame. Maybe there's a bug in Teredo LSP that the nVidia LSP exposes. Until someone can identify the code path that is causing the heap corruption, or corrupting the pointer that NvAppFilter is using, you don't know who's to blame. On the other hand, Microsoft's own stuff is the most tested code on the planet. And as a rule if IE or Explorer is crashing it's safe to assume it's due to some 3rd party code. Larry Osterman pointed out that "One in a million is next Tuesday" for Microsoft (http://blogs.msdn.com/larryosterman/archive/2004/03/30/104165.aspx), and Explorer faults are two orders of magnitude more likely to be caused by code that isn't Microsoft's (http://blogs.msdn.com/oldnewthing/archive/2008/05/21/8525411.aspx)Anonymous
June 03, 2008
The number of times I've seen a crash or a bluescreen caused by a dll that started with the letters "nv" is depressing. I've actually just switched to an AMD/ATI videocard b/c I'm so sick of shoddy NVidia driver quality. Thanks for another fun walk-through, Mark! :)Anonymous
June 03, 2008
Mark - I'm no longer in the Windows world as much - I'm more involved on the OS X side of things... but the advice you give applies to both sides. Although the tools are different, understanding what to look for in stack traces is an invaluable asset in troubleshooting an errant process or program. I use the OS X equivalent of Process Monitor (XRay/Instruments) quite a bit to analyze hangs, and I read any crash trace that comes up (although symbolication is a little more difficult than on Windows) to see why things are crashing. Because of that, I have a lot better understanding of what's really going on under the covers. Thanks, and keep up the good work!Anonymous
June 03, 2008
I really enjoy reading these types of posts. Thank you for taking the time to write it for us.Anonymous
June 03, 2008
A glance at the <a href="http://www.google.com/search?hl=en&q=+site:forums.nvidia.com+nvappfilter">NVidia forums</a> seems to show that nvappfilter.dll is associated with something called the "NVidia Firewall" (possibly aka "nam"). I don't think a video card company has any business writing firewalls.Anonymous
June 03, 2008
One can only hope that someone responsible at NVidia reads this blog, or that you Mark have a contact through Microsoft to pass this information onto them... a most excellent and informative debugging journey.Anonymous
June 03, 2008
BTW, if you try the LSP "fix" used in this article on a pre-Vista operating system, you'll likely lose network connectivity due to a corrupt LSP stack. Only Vista and later know how to automatically fix this...Anonymous
June 03, 2008
Mark, great post. @Ross: It's worth pointing out that nVidia now provides full chipsets to motherboard manufacturers. They are much more than just a "video card company" nowadays. For the longest time I only used nVidia because I couldn't stand ATI drivers. Lately however, nVidia drivers are getting terrible (the new "advanced" control panel is the perfect example). I might have to re-evaluate and switch to ATI.Anonymous
June 03, 2008
The Nvidia Firewall has had problems for years now. It never worked properly under XP, so I doubt if it is certified under Vista anyway. Just uninstall it. It is in your Add/remove programs as the "NVIDIA ForceWare Network Access Manager". I never install it on any nForce motherboards. It is not worth the hassle.Anonymous
June 03, 2008
Phileosophos (and others have) noted - "... don't have the kind of familiarity with WinDbg necessary to find such things. And I doubt all that many other developers do either." What most of us need is a handy "what to do and how to do it when we need it" guide. Guess what? If you have downloaded the free MS Windows Debugger, you already have this guide. It's the attached "Debugging Help" file. Not only does it explain how to use the 'debugger' interface, it's got a built-in step-by-step guide on "how to" debug specific kinds of problems. Open the Help File and then go to the "Debugging Techniques" section on the "Contents" tab. A few of the sections are: Elementary Degbugging techniques (you probably already know these being a developer), Bug Checks (Blue Screens), RPC Debugging, Plug and Play, Advanced Techniques, etc. I highly recommend that anyone new to debugging review what's here (since it 4 MB, there's a LOT of information available). Especially since it's free! Of course, there are also several books on the market that cover these topics as well.Anonymous
June 03, 2008
Thanks Mark, another great post. However, you can't rely on software tests like Windows Vista Memory Diagnostic to detect bad RAM, as they will only prove the RAM is faulty and not that it is good. The best way to test RAM is to either use a hardware RAM tester or swap the suspect RAM with known good RAM and test over a period of time to see if the symptoms disappear.Anonymous
June 04, 2008
The comment has been removedAnonymous
June 04, 2008
Mark: This might be a bit too personal, but how much gaming do you do? What games are you playing?Anonymous
June 05, 2008
The comment has been removedAnonymous
June 05, 2008
Oh Dear Lord! I have been having this exact same issue on my machine and put it down to an Axis Media control problem. I just disabled the filters and no crashes for me anymore! Thanks! NickAnonymous
June 05, 2008
Hey Mark: I agree with Ilya above, it's fantastic you continue with these posts. I'd like to thank you for your website, your blogs and your tools; they're what made using Windows bearable for me, because they gave me some control. Please don't stop what you're doing. On the other hand, I really rediscovered the joy of computing when I switched to linux... a different solution to yours, I guess. (chuckles)Anonymous
June 06, 2008
Thanks! This post helped me track down a persistent problem I've had launching IE. It was strange, because I've used tools to reset and remove all my third party plug-ins, but did not resolve the problem. The strangeness was compounded by the fact that I could run IE fine as an Administrator, but not as the default identity. I used the debugger the way you demonstrated, and found that the cause was a dll from Pantone written for XP which had hooks in to the browser rather than installing as a plug-in. As soon as I uninstalled Pantone Colorist, everything works fine.Anonymous
June 06, 2008
Hello Mark, Thank you very much for this informative blog and excellent advice. I am grateful for your tools and really look forward to seeing what you guys have been able to do in the transition from Winternals ERD Commander to DART. Would DEM provide some kind of functionality to help IT shops better capture and monitor crashdumps and the even more dreaded BSODs? Maybe you can talk about these in a future blog posting? :-)Anonymous
June 07, 2008
Hello Mark, Thank you for the great post. I'm looking forward to the next one. :-) Thanks, ArpadAnonymous
June 07, 2008
I've got an nForce 4 motherboard (ASUS A8N SLI deluxe) with nVidia's "onboard firewall" and had many problems with it, mostly corrupted downloads. The problem even manifested itself in corrupted .JPEG's in webpages, which I at first thought was the webservers' fault... It would also block certain communication. I hate it when they use Apache to run a webbased configuration UI, which is only intended to be used locally anyway :| I removed nVidia's "onboard firewall" software and switched to Windows' built-in firewall. It has worked very well.Anonymous
June 07, 2008
The comment has been removedAnonymous
June 07, 2008
telling mark that his post is great is as normal as saying "you know, it kinda rains in redmond" :-) obsolutely great post, as always! to have mark posting from microsoft is a great asset to all of us (more or less engaged in system development) ps in the (far) future, it would be nice to see something "the case of windows kernel" where you will argue (on behalf of the best of us) about how great would be to be able to fully debug the windows kernel... :-) great, thanks again mark! dAnonymous
June 08, 2008
i am a little bit amazed about how many people said "oh, this is so difficult, for the rest of us" when in fact, in os shops (not even at kernel32, user32, gdi32 level but higher, let's say ntdll) qa engineers are actually required to narrow down issues using (business as usual) tools like windbg and so on... these cases are normal engineering procedures, most programmers (not even from r&d should instinctively follow) - except that mark is "dressing" them in inspired sh holmes paragraphs and nice screen shots (that's his unique talent! no doubts about that) but the fact reamains that most of you expressed perplexity about normal engineering processes... and of course, it makes me wonder... of course, in a positive and productive way (as always :-) regards, dAnonymous
June 09, 2008
The comment has been removedAnonymous
June 10, 2008
Some of the random "NVIDIA" crashes can be attributed to their partners that put the chips on the PCI express cards. Some of these (OEMs?) have even admitted this problem by suggesting that if you have problems you should 'clean' the pins. However that's not the whole extent of the issue. I've verified on different brand (asus,gigabyte) Intel P35 motherboards and two different Nvidia 8800 GT units that that atleast certain of these boards are either too thin or the pins have otherwise poor contact. The cards sway sideways so much that even if the card is "properly" seated and locked in, the computer can either not boot or you can have random crashes or even just random flickering to blank screen without any crash etc. Just supporting the card slightly so it sits more straight can resolve the issue. Another part of the issue that the PCI Express connector is shorter in height compared to say regular PCI and thus makes this swaying more likely.Anonymous
June 11, 2008
As someone coming from the administration/operations side of the tech field, not from the developer side, I very much appreciate the specific details of how to troubleshoot at this level, especially the WinDbg instructions. I have to admit, until this post I had assumed (not sure why) that WinDbg and Symbols access were something that required a MSDN subscription. Now I know, thanks!Anonymous
June 13, 2008
knowledge power, excellent teaching, simplificative, etc. etc. thanks for your postingsAnonymous
June 13, 2008
I did a review of your blog for my technical program at school. Very well done. Here's the text
Troubleshooting skills are always valuable when any computer stops working. Especially when computers continually fail to work by crashing. I found Mark's Blog interesting in that he identified the problems very clearly. It was interesting to read how he came to view certain things about services and memory dumps. The tendency for users to blame the operating system because of incompatible drivers or services seems to be way too rampant. I realized this after reading some comments on this blog. I'm not sure if my troubleshooting skills will reach the level of Mark's. However, with the right experience and tools, I can hope for success in similar problems. Writing about technical complexites are much easier with print screen and highlighted text. I did appreciate the screen which broke up a possible dull read. Whether or not this article was entertaining, remains the responsibility of the reader. Teaching others the methodologies of fixing certain items will always be more important than just dishing out entertainment.
Anonymous
June 13, 2008
The comment has been removedAnonymous
June 17, 2008
I'm having the same problem. Can you give some simple instructions to a novice on how to fix this problem. Neither HP or Microsoft is able to help me. I'm running Vista.Anonymous
June 17, 2008
crash of window, errors not capability of download, now slow and hard to end all programs . not able to use explore any more. sorry I'm not able to e-mail any one can receive just can't if exploer is needed. windows not running right. did ugrade memerory, old to 512mb 64x64 borad.Anonymous
June 18, 2008
Mark - great post. I have always wondered how to debug crashes in Windows, this will get me started correctly. Thanks.Anonymous
June 19, 2008
i have recently purchased a Vista-loaded Sony notebook. after starting it up, Vista proceeded to install WMP, after which WMP crashed at the first invocation. this blog is very timely, as i can't get any information on the web - and i'm no Windows programmer to debug the details. i have avoided using WMP by installing VideoLan's VLC, and SMPlayer from http://smplayer.sourceforge.net/ thank you, Mark!
- ravi.
Anonymous
June 22, 2008
The comment has been removedAnonymous
June 23, 2008
I'm having the same problem, but I get that same error message when I boot up my machine, even before I try to run WMP. Then I also get the message whenever I try to use WMP. Its not an occasional thing-all the time. Is it all related to the same problem mentioned above ?Anonymous
June 23, 2008
It's quite clear that a lot of your debugging uses the occular trauma method - "stare at the problem until the answer hits you between the eyes".Anonymous
June 24, 2008
Thank you, Mark, for another excellent and informative article. Every time that I read one that includes a dbug, it reminds me how little that I really know of dump analysis (I mean this in a positive manner)- and how much there is to still learn!Anonymous
June 27, 2008
The comment has been removedAnonymous
July 01, 2008
This is excellent! I have similar issue with the newest winamp 5.53 :-) It was crashing afer a few seconds of playing. Basis on your article I've found that nde.dll was causing this. :-) THANKS! :) Kind regardsAnonymous
July 01, 2008
Thank's Mark. I'm have a second job an system administartor and i'm uninstall on all machines NVidia firewall because it very buggy and frequently cause BSOD.Anonymous
July 05, 2008
Mark, great post. I have known that Windbg is very powerful and can help with lot of such crash issues. Just that i have never gone ahead and spent time to learn to use it. Is there any crash course guide or something available to help me with that? On a side note, I have seen the Checkpoint Securemote VPN software causing blue screens on my Vista every time I enable it on my Lan connection. The crash isn't predictable and happens anytime during the day. I hence have to keep it disabled. Have you come across this?Anonymous
July 09, 2008
The comment has been removedAnonymous
July 10, 2008
good artical. It's clear and easy to understand. waiting for your new post.Anonymous
July 10, 2008
Excellent post Mark, as usual... Sorry for my english, I'm from Argentina and out of practice. I don't have the 0,0000000000001 % of your knowledge, but I discovered a similar error myself, but with a 915 Intel video 3D accel. internal card. The difference is that it took me 2 years to discover it was the drivers of the card because the freeze was so erratic and strong that I couldn't get any information of it with my XP pro system (or I didn't knew how to do it). Finally, when I discarded everything else (with hardware checks and reinstalling software by software, even my XP), the only thing left was the drivers of the Intel card. AND THERE WAS THE PROBLEM!!! But with ANY VERSION of the drivers!!! So my only solution (since Intel left a lot of people -including me- with problems related to the 915 chipset cards) I bought a nVidia card and solve the issue... Why is soooo difficult to make good video drivers? I know it's REALLY difficult, but we are talking about BIIIG corporations here... Anyway, thank you for sharing your knowledge with us. You are a genius Mark. Gastón.Anonymous
July 11, 2008
The comment has been removedAnonymous
July 19, 2008
The comment has been removedAnonymous
July 22, 2008
Thanks Mark. Many of your articles read as a detective. In addition on a painful theme for me. Today I was looking biggest resources consumers on my system. It was very surprised that Windows Live Messenger use from 30 to 40 threads, it is the only program for instant messaging, while Visual Studio with ARCHSVN and Resharper addons satisfied with only 30 threads. Live Messenger retains over 800! GDI of objects, while Visio with a large scheme use them in all 400. Programisty bad habits exist even in Microsoft, but learn from the mistakes they can become better. Could you find time to hold a lecture for the Windows Live Products department about economical use of system resources, because such impression, that they test the products on 32CPU monster with 2 TB of memory from next article? P.S. I would give up the use of Live Messenger, however all my partners in the US use it.Anonymous
October 08, 2009
I had a similar problems with configuring RAID on a NVIDIA board. For the strangest of reasons it had reverted back from RAID to Non-Raid configuration. Found out from the dumps that one of the driver was not happy on Windows 2008 , checked on Nvid's site for WS 2008 support for RAID drivers - didnt find any.