The Cases of the Blue Screens: Finding Clues in a Crash Dump and on the Web
 My last couple of posts have looked at the lighter side of blue screens by showing you how to customize their colors. Windows kernel mode code reliability has gotten better and better every release such that many never experience the infamous BSOD. But if you have had one (one that you didn’t purposefully trigger with Notmyfault, that is), as I explain in my Case of the Unexplained presentations, spending a few minutes to investigate might save you the inconvenience and possible data loss caused by future occurrences of the same crash. In this post I first review the basics of crash dump analysis. In many cases, this simple analysis leads to a buggy driver for which there’s a newer version available on the web, but sometimes the analysis is ambiguous. I’ll share two examples administrators sent me where a Web search with the right key words lead them to a solution.
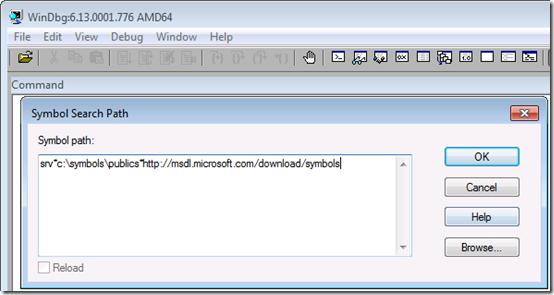
Debugging a crash starts with downloading the Debugging Tools for Windows package (part of the Windows SDK – note that you can do a web install of just the Debugging Tools instead of downloading and installing the entire SDK), installing it, and configuring it to point at the Microsoft symbol server so that the debugger can download the symbols for the kernel, which are required for it to be able to interpret the dump information. You do that by opening the symbol configuration dialog under the File menu and entering the symbol server URL along with the name of a directory on your system where you’d like the debugger to cache symbol files it downloads:
The next step is loading the crash dump into the debugger Open Crash Dump entry in the File menu. Where Windows saves dump files depends on what version of Windows you’re running and whether it’s a client or server edition. There’s a simple rule of thumb you can follow that will lead you to the dump file regardless, though, and that’s to first check for a file named Memory.dmp in the %SystemRoot% directory (typically C:\Windows); if you don’t find it, look in the %SystemRoot%\Minidumps directory and load the newest minidump file (assuming you want to debug the latest crash).
When you load a dump file into the debugger, the debugger uses heuristics to try and determine the cause of the crash. It points you at the suspect by printing a line that says “Probably caused by:" with the name of the driver, Windows component, or type of hardware issue. Here’s an example that correctly identifies the problematic driver responsible for the crash, myfault.sys:
In my talks, I also show you that clicking on the !analyze -v hyperlink will dump more information, including the kernel stack of the thread that was executing when the crash occurred. That’s often useful when the heuristics fail to pinpoint a cause, because you might see a reference to a third-party driver that, by being active around the site of the crash, might be the guilty party. Checking for a newer version of any third-party drivers displayed in this basic analysis often leads to a fix. I documented a troubleshooting case that followed this pattern in a previous blog post, The Case of the Crashed Phone Call.
When you don’t find any clues, perform a Web search with the textual description of the crash code (reported by the !analyze -v command) and any key words that describe the machine or software you think might be involved. For example, one administrator was experiencing intermittent crashes across a Citrix server farm. He didn’t realize he could even look at a crash dump file until he saw a Case of the Unexplained presentation. After returning to his office from the conference, he opened dumps from several of the affected systems. Analysis of the dumps yielded the same generic conclusion in every case, that a driver had not released kernel memory related to remote user logons (sessions) when it was supposed to:
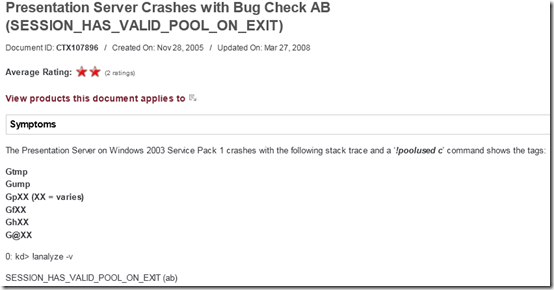
Hoping that a Web search might offer a hint and not having anything to lose, he entered “session_has_valid_pool_on_exit and citrix” in the browser search box. To his amazement, the very first result was a Citrix Knowledge Base fix for the exact problem he was seeing, and the article even displayed the same debugger output he was seeing:
After downloading and installing the fix, the server farm was crash-free.
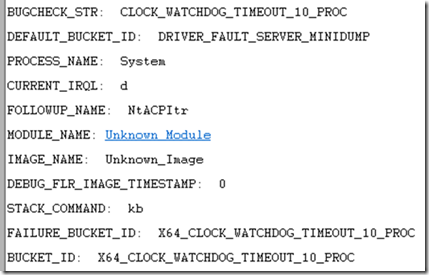
In another example, an administrator saw a server crash three times within several days. Unfortunately, the analysis didn’t point at a solution, it just seemed to say that the crash occurred because some internal watchdog timer hadn’t fired within some time limit:
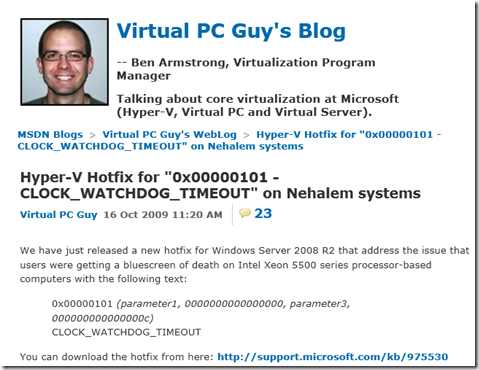
Like the previous case, the administrator entered the crash text into the search engine and to his relief, the very first hit announced a fix for the problem:
The server didn’t experience any more crashes subsequent to the application of the listed hotfix.
These cases show that troubleshooting is really about finding clues that lead you to a solution or a workaround, and those clues might be obvious, require a little digging, or some creativity. In the end it doesn’t matter how or where you find the clues, so long as you find a solution to your problem.
Comments
Anonymous
January 01, 2003
Thank you, Mark. Very helpful. Actually, I am analyzing a dump file with bug check: SESSION_HAS_VALID_VIEWS_ON_EXIT (ba). But I am not lucky enough, the proper cause of this BSOD is not a driver fault. Maybe it's caused by handle leaks, I still need a final confirmation from the vendor company. I think this case is a deep digging, not a little one. I know, "No pains, no gains". But BSOD analyze is really not a easy job for system administrator.Anonymous
January 01, 2003
@karl It's an internal version that will eventually make its way into the SDK. Thanks for the feedback.Anonymous
January 01, 2003
@ Great post: When diagnosing MSI issues, enable the 'voicewarmup' logging (support.microsoft.com/.../314852) and do a ProcMon capture. The MSI log will tell you the reason, or will help you identify what part of the ProcMon to review.Anonymous
January 01, 2003
The comment has been removedAnonymous
January 01, 2003
Great topic. How would an IT troubleshoot the BSOD, 'An attempt to release a mutant object was made by a thread that was not the owner of the mutant object' ? It happens during logout, and I know which processes are using mutants. But the vendor is taking a long time to figure it out. In my dreams, I could just turn on procmon boot logging, and point to which thread released the mutant, but I don't think it's possible.Anonymous
January 01, 2003
@Raj: Addison Wesley - Advanced Windows Debugging: www.amazon.com/.../0321374460Anonymous
January 01, 2003
@ MickC: The PROCESS_NAME is the process that was scheduled at the time of the bugcheck. The process itself may not have been the instigator though if it was pre-empted. That is, an interrupt, DPC or APC occurred. In these cases, the process's thread stack context is stored (in a trap) and the pre-empting code takes over control (i.e. it is run the CPU core). In general, the PROCESS_NAME rarely relates to the cause.Anonymous
January 31, 2011
Good to find you driving people to open up crash dumps and give it a shot. Which book in your opinion is good for learning WInDbg. I mean do it the big way.. to hunt down any bluescreen that comes your way. Thanks.Anonymous
January 31, 2011
www.dumpanalysis.org and the Advanced Windows Debugging book.Anonymous
January 31, 2011
The comment has been removedAnonymous
January 31, 2011
Mark, is windbg 6.13 a public release?Anonymous
February 01, 2011
Excellent article. How does one obtain the windbg version 6.13?Anonymous
February 01, 2011
Excellent Article as always Mark. With regards to Symbol files, is it based on the client with WinDBG installed or the type of dump file I'm analyzing?Anonymous
February 05, 2011
@ Glenn: Symbol files are based on the dump file you are analyzing (to be more precise, they are based on the type and version of each specific module located in the dump). You can use x86 WinDbg to look at x64 crash dumps and vice versa.Anonymous
February 12, 2011
Great post as usual, and nice information by Andrew in the comments! I will have to remember this manual crash dump generation procedure to help try and find problems in a system. It's always hard finding why an application isn't working, or a crash isn't working, etc. Mark, I'd love to see a post about how to diagnose and troubleshoot installation/windows installer errors and how to do some analysis for cleanup. I've run into a lot of situations where for some reason certain applications won't install properly and aren't uninstalled cleanly. Trying to repair the app fails as well.Anonymous
March 10, 2011
Thanks for the post Mark. I'm working to wrap my brain around Windbg. Can someone answer the following? When looking at a Minidump file, what does the PROCESS_NAME field refer to? Case in point. We have some HP Notebooks and desktops that recently started crashing after KB2393802 was applied. The culprit was an an Intel Graphics Driver. Once updated the issue was resolved. The PROCESS_NAME in each of the notebook dumps refered to HPWA_Main.exe, while the desktops referred to iexplore.exe. I can draw the link between IE and the video driver but where does the Wireless Card fit into this? Thanks for any insight!Anonymous
March 11, 2011
Thanks Andrew. Very helpful. I was never sure what the significance was or where it fit into the crash.Anonymous
March 15, 2011
Thanks a lot Mark. It is realy very good and helpful.......I really appreciate it........Anonymous
April 24, 2011
@ Mark Russinovich : many thanks - this worked perfectly. The issue I was facing is a BSOD occuring just after I type the password of my encrypted Western Digital "My passeport - 500 Go" external hard drive and press "Enter" on a XP SP3 station. (In any other "normal" station, the authentication would succeed and the WD disk becomes visible under My Computer). For months, I used to run a Windows 7 VM inside the XP, mapping the HDD to Win 7 then sharing it on the Network from the VM.... :D oufff "RAM angry workaround" :) but not a solution... When the BSOD problem happens, no log data to begin with ... - nothing on event viewer also - After following these debugging tips, I now know for sure that the bug was due to SGEFLT.SYS file (the system disk is "also" encrypted :) using Safeguard Easy). "All i understood" is that this safeguard driver version installed on the station was a legacy version causing these BSOD to happen when dealing with USB devices managed by device lock service ....... Using the file name given by the crash dump analysis, I found this link (that fixed my issues) : "www.utimaco.com/.../W27GVC4F014OBELEN**&db=C1256F63004688CE&q=PKD_Search&nm=0&unid=66AB8A11AA1E84F7C12573B100611300&view=sgi&LG=EN&ip=66.249.65.4&j=1" Many thanks again !!Anonymous
October 25, 2013
What if you don't have a crash dump? When the server just hangs? I've got a case where a customers terminal server will hang every second day or so (just one session, but the user can't logon anymore), the server will not shutdown or restart and only a hard reset will fix the issue - for a day or so. I'd guess this is a device driver running havoc, but I've got no idea how to find the culprit. I even used a MS break/fix incident but the team declined to look further, they said I'd need a "root cause investigation" for this which is not in our support contract.Anonymous
November 22, 2013
@Radeldudel: Use Ctrl-Scroll-Scroll to cause a bugcheck, then email me - defragtools@microsoft.com. Windows Registry Editor Version 5.00 [HKEY_LOCAL_MACHINESYSTEMCurrentControlSetServiceskbdhidParameters] "CrashOnCtrlScroll"=dword:00000001 [HKEY_LOCAL_MACHINESYSTEMCurrentControlSetServicesi8042prtParameters] "CrashOnCtrlScroll"=dword:00000001


