VS2010: Silverlight 4 profiling from Visual Studio UI
In my previous post I showed how VS2010 Profiler command line tools can be used to profile your Silverlight 4 application, as this feature is only partially integrated with Visual Studio UI. While we are working on a full integration story, let me show you how VS UI can be used (with some extra work) currently to get same results as you get using the command line tools.
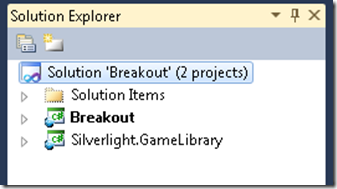
We will use the same Breakout Game example, which is open as a project in Visual Studio at the beginning:
As Silverlight project is not currently recognized by the Performance Wizard, you better start with creating an empty Performance Session. You can do it from the Analyze menu (Analyze –> Profiler –> New Performance Session):
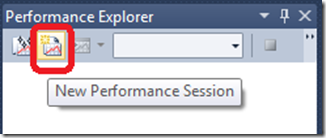
or by clicking a New Performance Session button in Performance Explorer:
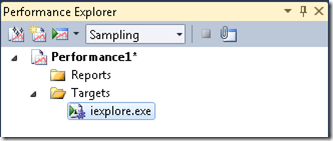
When a new Performance Session is created, it has empty Reports and Targets nodes. Now right click on Targets, select Add Target Binary and pick up c:\Program Files\Internet Explorer\iexplore.exe (or c:\Program Files (x86)\Internet Explorer\iexplore.exe, if you work on x64 machine):
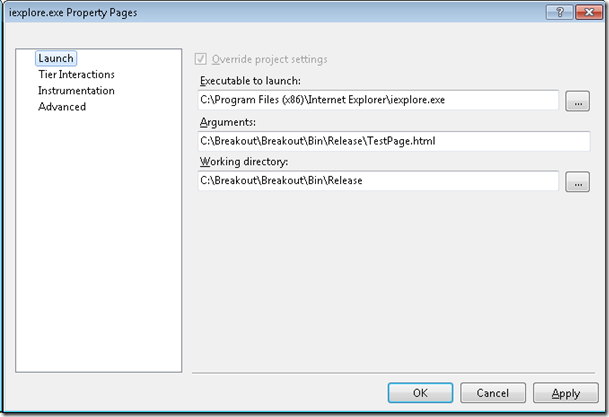
Next step is to right click on iexplore.exe node, select Properties, and then select Launch tab in the Property Pages window. The “Executable to launch” is set already, but you should add Arguments and Working directory for your application.
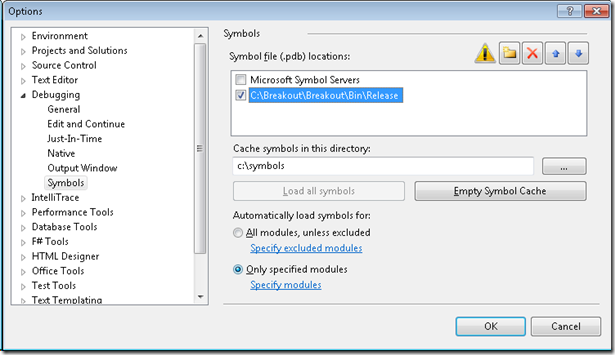
The last preparation before you can start measurements is to make sure your Symbols setting includes the binary directory where the application is compiled. This is currently required for correct symbols resolution. You can find the Symbols setting in Tools –> Options –> Debugging –> Symbols (it is under Debugging and not Performance Tools, as both Debugger and Profiler share the same setting for Symbols).
Now you can click Start Profiling button  in the Performance Explorer, and Internet Explorer will be started under profiler, running your application. As I mentioned in the previous post, there could be number of IE processes while your application is running. Yet Visual Studio attaches Profiler to only first of them, and doesn’t reattach it automatically to other spawned processes. Thus, you have 2 options here – either to eliminate creation of child processes by IE through the registry (modifying TabProcGrowth value), or attach profiler to additional IE process (one or many) before you start running your scenario. Simultaneous profiling of several processes is supported, and you will actually profile all IE processes that you attach the profiler to. Those processes that run your application will generate a valuable profiling data, while rest could be later ignored.
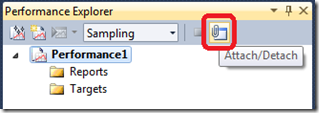
You can attach to additional processes using Attach/Detach button of Performance Explorer:
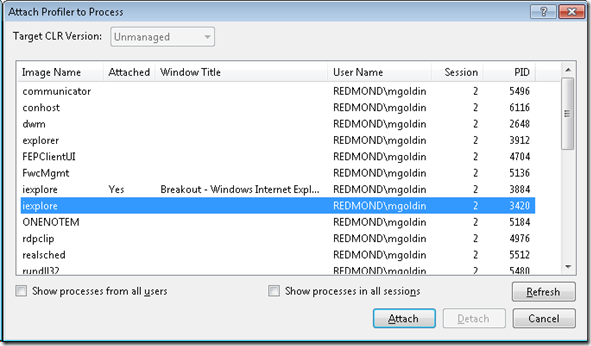
In our example, you can see in “Attach Profiler to Process” dialog that the profiler is attached already to one IE process, and now you will attach it to yet another one.
After you finish your scenario, close IE window and profiling results will be automatically open for you in Visual Studio, so you can navigate it using all views as usual:
Enjoy!
Comments
- Anonymous
June 01, 2010
The comment has been removed - Anonymous
June 01, 2010
The comment has been removed - Anonymous
June 02, 2010
Hi Sergey! In that case, you can give IE the URL path as a parameter, and you supply the local path to your PDBs and DLLs for symbols resolution.
