How to Profile NUnit tests using the Visual Studio 2010 Profiler
Profiling NUnit tests can be achieved in a few simple steps. The first step, of course, is to decide on which method of profiling is best suited to analyze the performance of your unit test. One of my earlier posts addresses this question, which you can find here. In this post, I will use “CPU Sampling” to illustrate the steps necessary to profile NUnit tests. In a future post (hopefully in not so distant future), I will put together a similar post for using the “instrumentation” method.
One Item to Note Before You Start
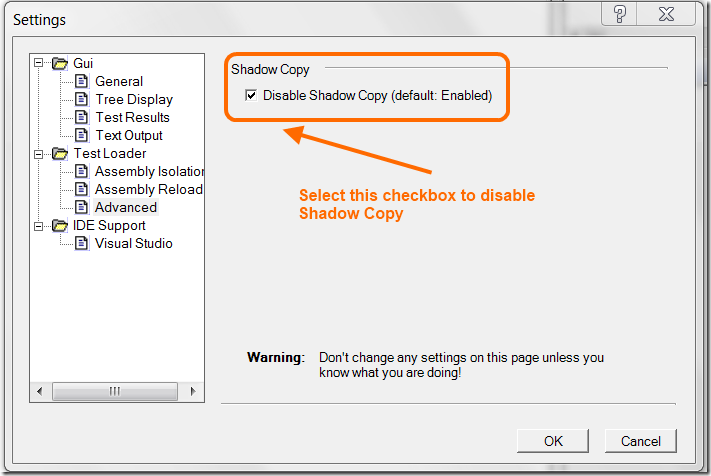
NUnit has a built in feature called “Shadow Copy”, which [as it appears on the surface] moves the test and application binaries to a temporary location before running the tests, and removes those DLLs from the temporary location when it is terminated. Depending on how your test and application’s binaries are setup to interact with one another, the Profiler may not be able to accurately locate the correct binary during its analysis stage and would not be able accurately tie back the collected performance data to source code. Therefore, you may want to consider disabling shadow copy when profiling NUnit tests. In NUnit, you will find this option under Tools -> Settings.
Figure 1 - Disabling Shadow copy in NUnit
Profiling NUnit Tests in “CPU Sampling” Mode
The first step to analyze the performance of any binary is to create a performance session. The easiest way to create a performance session is to use the Alt-F2 shortcut to launch the wizard. Alternatively, you can launch the performance wizard from the “Analyze” menu.
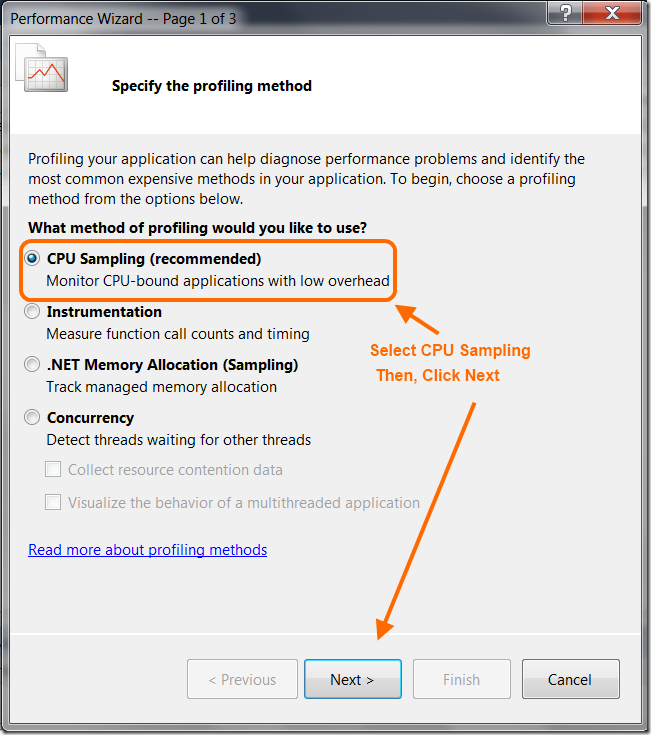
On the first page of the wizard, choose “CPU Sampling” and then click “Next”
Figure 2 - Select CPU Sampling on Performance Wizard
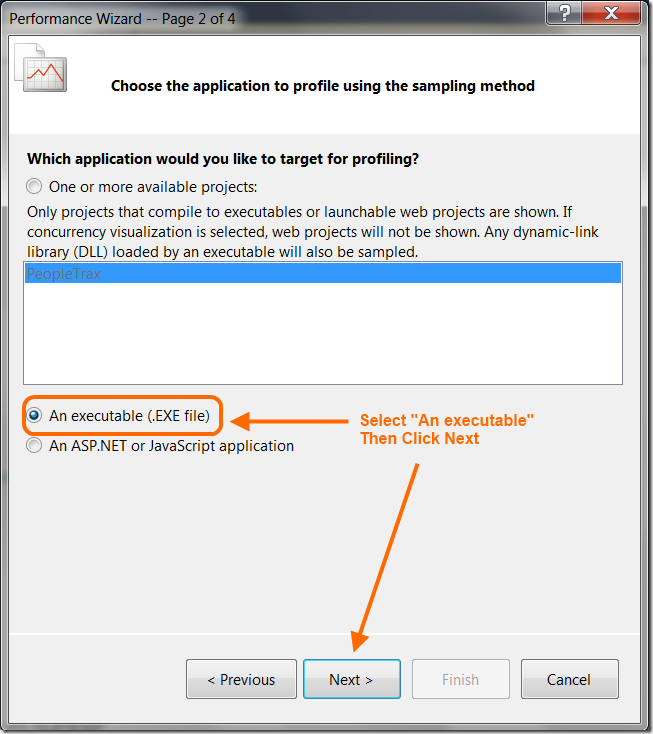
On the second page of the wizard, select “An Executable (EXE File)”, and then click “Next”
Figure 3 - Select "An Executable" on Performance Wizard
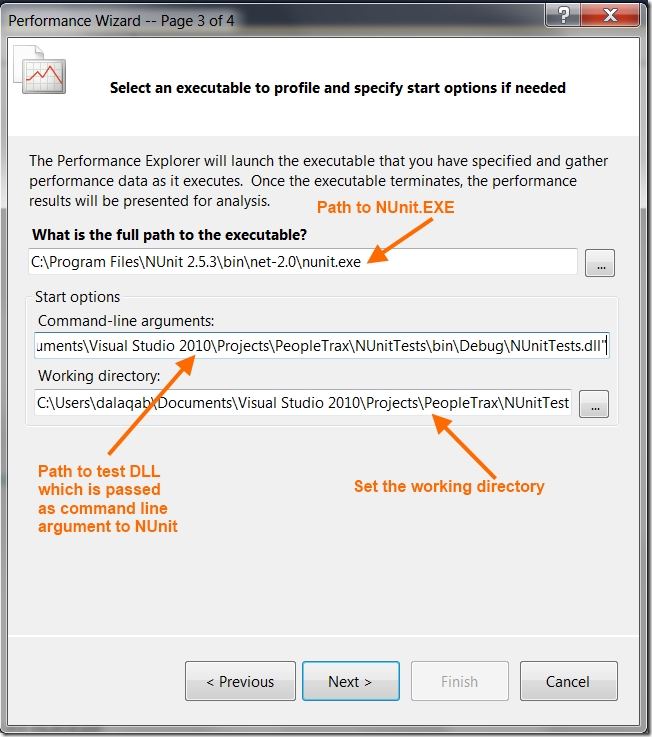
On the third page of the wizard, you will see 3 text boxes. Since we are profiling NUnit tests (which are DLLs) we need to tell the profiler which executable should be used to run the desired NUnit tests. Therefore the first piece of information we need to provide profiler where to find NUnit.EXE.
Then we should have the profiler, tell NUnit.EXE how to find the test DLL, by providing a path to the test DLL on the “Command-Line Arguments” text box. Finally, we should make sure that the working directory is set correctly and that NUnit can locate all the binaries it needs. Once the information is provided, click “Next”
Figure 4 - Tell Profiler which application to Launch on Performance Wizard
On the last step of wizard, keep the “Launch profiling after wizard finished” check box checked, and click finish.
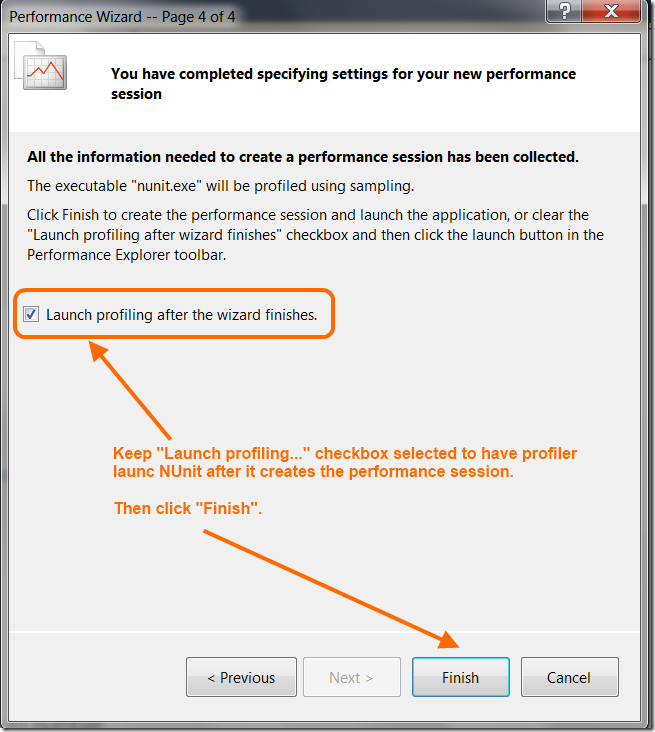
Figure 5 - Last page of the Performance Wizard
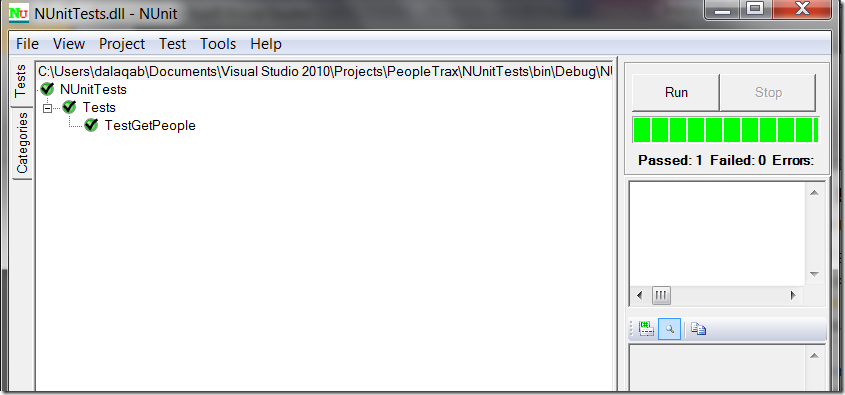
Once NUnit is launched, run the tests as you normally do. When finished, close NUnit.
Figure 6 - Run your tests using NUnit GUI application
The Profiler will then analyze the data it has gathered and will display the performance report.
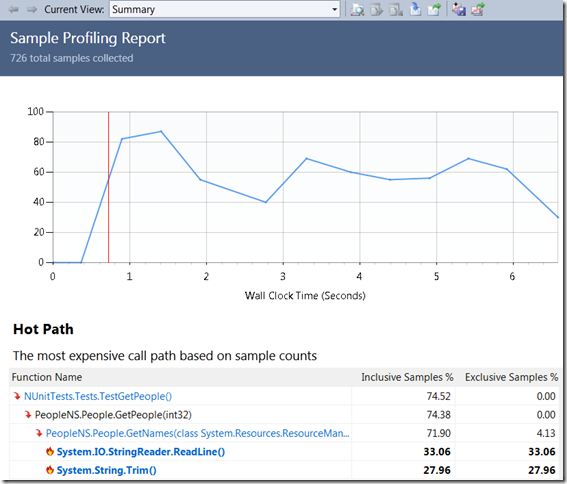
Figure 7 - Profiler Report
