VS2010: Silverlight 4 profiling
Did you know that Visual Studio 2010 Profiler allows you to profile your Silverlight 4 applications? You didn’t? It does.
This feature, however, is only partially integrated with Visual Studio UI, and you need to use command line tools to collect the data. After that, you can open the resulting .VSP file in Visual Studio as you normally do after other types of profiling, and enjoy rich visualization experience while investigating your performance problems.
Yes, we know it is not as cool as clicking VS buttons. We are working on a better experience. Yet I thought it is worth to emphasize that there is a way to use command line tools for customers that seek performance improvement in their Silverlight applications.
Let assume you develop an application like Breakout Game.
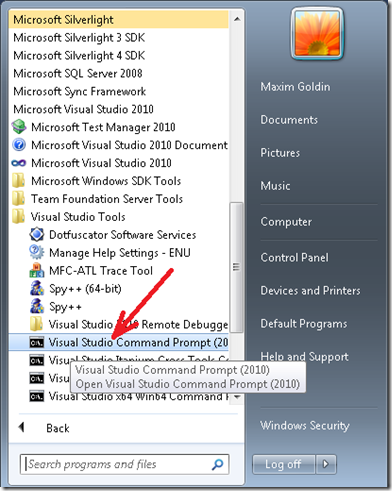
You compile it inside VS2010, run it, and want to profiler it. Performance Wizard tells you that this project can not be launched by the profiler. Alas. Time to go to the command line tools. Click you Start button, go to All Programs and find there Microsoft Visual Studio 2010. There, go to Visual Studio Tools and launch a Visual Studio Command Prompt (2010).
This command line window has predefined PATH that includes profiler command line tools:
Now go to the directory where your Silverlight binaries are compiled:
>cd c:\Breakout\Breakout\Bin\Release
We are ready to start our profiling session.
- VSPerfClrEnv /sampleon
- "c:\Program Files (x86)\Internet Explorer\iexplore.exe" C:\Breakout\Breakout\Bin\Release\TestPage.html
- VSPerfCmd /start:sample /output:MyFile /attach:<PID of iexplore.exe process>
- Run your scenario
- VSPerfCmd /detach
- VSPerfCmd /shutdown
- VSPerfClrEnv /off
Steps above require some explanation. In 1 – you prepare environment that is needed for Silverlight profiling, and in 2 you start your hosting process (iexplore.exe, in our example) within that environment. This is essential, as if you start IE by clicking an icon on your desktop, you will get no Silverlight profiling data at the end. Step 3 starts profiler in Sampling mode, and attaches it to the process of your choice. Keep in mind that you might have multiple IE processes running, so you need to choose one that runs your code. If you are not completely sure which one is it, or if your code runs in several IE processes – well, attach to all of them! You can do it either running “VSPerfCmd /attach:<PidN>” several times, or enumerating all PIDs in a single command: “VSPerfCmd /attach:PID1,PID2,PID3”. After profiler is attached, you run your scenario in step 4, and detach profiler from all target processes in step 5. Detaching is not enough, as you need to shutdown the profiler in order to finalize your result file (step 6). Step 7 cancels changes of the environment that are made in step 1.
It could be that you need to profile your application from the very beginning. In this case steps 2 and 3 can be combined into one, where you launch IE under profiler:
VSPerfCmd /start:sample /output:MyFile /launch:"c:\Program Files (x86)\Internet Explorer\iexplore.exe" /args:”C:\Breakout\Breakout\Bin\Release\TestPage.html“
The caveat here is that if IE process spawns a child process that will run your application, the profiler will be still attached to the “father” IE process, as it doesn’t re-attach itself automatically to spawned processes. You may, however, eliminate creation of child processes by IE8 through the registry, modifying TabProcGrowth value.
Please make sure that you run all the above steps from the directory where your binaries are located. Until we complete the integration of this feature with VS, your function names will not be properly resolved otherwise.
You can kill you IE process now. Open the MyFile.VSP in VS2010 as you would do normally for profiling results.
Formally, that would conclude an official support of Silverlight profiling in VS2010 – Sampling mode through command line tools.
However, if you want to try .NET memory or concurrency resource contention profiling of your Silverlight application – I won’t stop you. This is not currently supported and tested modes of work, but they might work for you and help you to see your performance problems from a different angle.
For .NET memory profiling, use “VSPerfClrEnv /samplegc” or “VSPerfClrEnv /samplegclife” in your step 1 to get either allocation profiling or allocation and lifetime profiling.
For concurrency resource contention – use “/start":concurrency,ResourceOnly” in the step 3 above.
Oren Nachman from Sliverlight team is another excellent source for Silverlight profiling information. In his great article he provides several additional tricks and options that you can find quite useful.
Enjoy!
Comments
Anonymous
April 28, 2010
So I managed to get this working the first time, but ever since then, whenever I try, I get the following error message when I open the file: "DA0002: It appears that the file was collected without properly setting the environment variables with VSPerfCLREnv.cmd. Symbols for managed binaries may not resolve." I'm definitely following the steps above, as I've retried it some half dozen times. Any thoughts on what might be going wrong?Anonymous
April 29, 2010
Hi smithkl42! When you run "VSPerfClrEnv /sampleon", a number of environment variables are set. Two of them are of the most importance for SL4 profiling - CORECLR_ENABLE_PROFILING=1 CORECLR_PROFILER={F1216318-0905-4fe8-B2E8-105CEB7CD689} Can you please double check that all of the below is valid in your case:
- You use latest available version of Silverlight 4 and VS2010
- You run your scenario from the directory where you SL4 binaries are located.
- You use IE8 and you start it from the prepared environment, not by clicking an IE icon.
- You attach to either all IE8 processes, or to the process that runs your SL code.
- You have CORECLR_ENABLE_PROFILING and CORECLR_PROFILER environment variables set in your target process
- You see VSPerfCorProf.dll is loaded into your target process.


