What code path is allocating the most bytes for a type?
In Visual Studio 2008, we added the ability to quickly determine the most expensive call stack in your application. In profiler parlance, the “most expensive call stack” is known as the “hot path”. What do we mean by “expensive”? “Expensive” is whatever measure you want it to be: number of samples in a function, time spent in a function, or even number of bytes or allocations in a function.
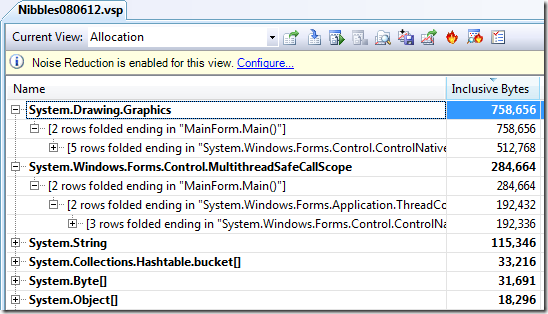
If you profile the managed memory usage of your application (also available in VS2008), you will get a new view in your profiling report called the Allocation View:
For each managed type allocated in your application, this view will show you the call stack where each allocation took place as well as the number of bytes and instances allocated in each function.
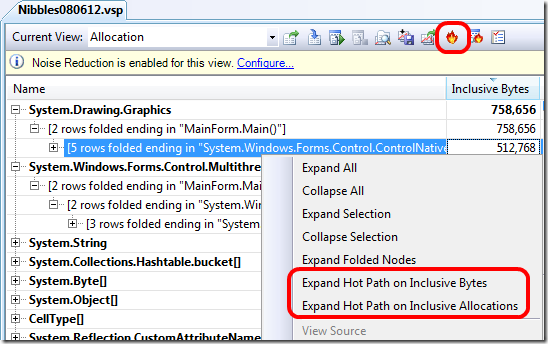
You can explore these call trees as you do normally, including using hot path to find the expensive allocation paths through your code for a specific type. This is accessible through either the toolbar or the context menu by right-clicking on the function from where you want to start hot path:
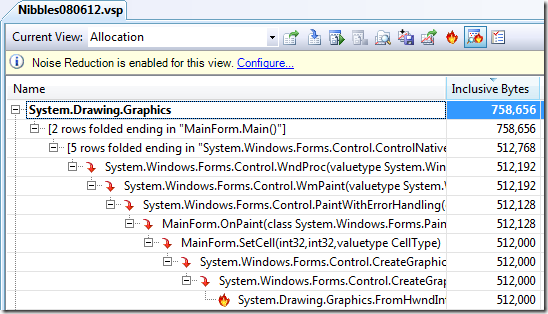
In this example, we know we’re allocating about 741KB of memory for System.Drawing.Graphics objects. Using hot path, we can quickly determine that the majority (67%) of the bytes are being allocated in System.Drawing.Graphics.FromHwndInternal. Because we do not control this code, we can look up the stack until we see code that we can change: MainForm.SetCell. This would be a great place to begin investigation.
It’s important to note that the allocation hot path is not the single function allocating the most bytes in your application (you can use the Function View for that). Instead, it is the specific path through your code that is allocating the most bytes for a type.
Comments
- Anonymous
February 05, 2009
[ Nacsa Sándor , 2009. január 19. – február 5.] Ez a Team System változat fejlett eszközrendszert kínál


