Got Exceptions? AppHub Windows Phone Application Crash Reporting
Any developer will tell you that debugging applications in production environments presents them with some unique challenges and applications on Windows Phone are no different.
With the new version of the AppHub developers portal debugging exceptions occurring within your applications on phones out in the wild just got a little easier. AppHub now allows registered developers to explore the relative health of their applications by seeing the recent crash count and then exploring the exceptions behind those crashes.
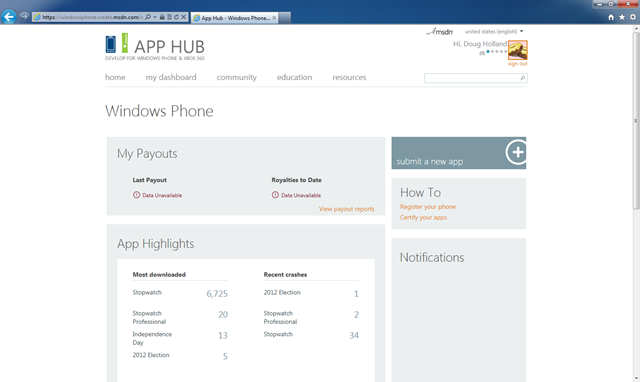
Opening the AppHub you’ll now see a section entitled App Highlights which lists your applications and their recent downloads as well as crashes.
AppHub – App Highlights showing most downloaded applications as well as associated crash count.
Windows Phone Stopwatch, for example, has experienced 34 recent crashes and the details of these exceptions can be accessed by clicking on the crash count. If you inadvertently click the name of the application it will take you to the application summary page instead of the crash count page.
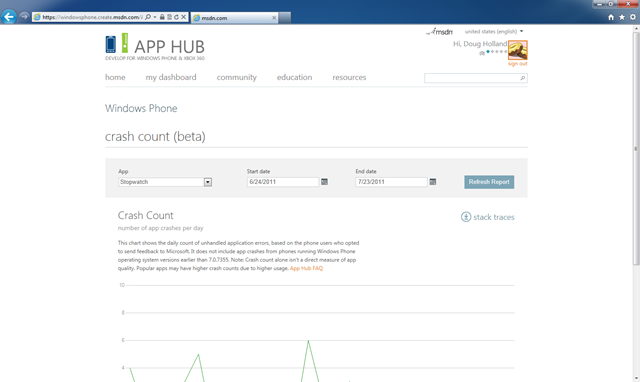
Within the crash count page you can see a graph detailing the crashes within the application over time or see crashes within all of your applications at one time. What is most useful however is the ability to then download details of these crashes within an Excel spreadsheet.
AppHub – Crash Count showing graph or recent crashes by application.
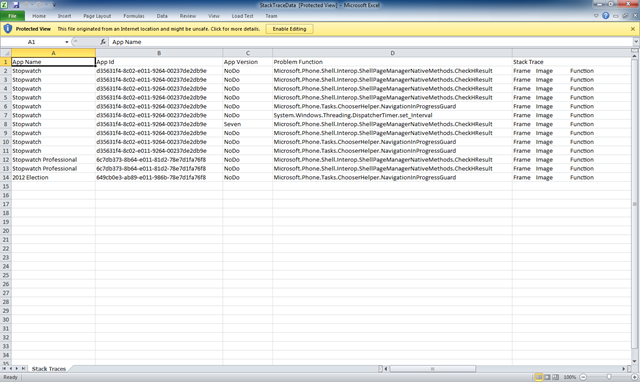
If you then download the spreadsheet you’ll then be able to access the level of detail necessary to further investigate the exceptions behind the crashes such as the exception message and associated stack trace.
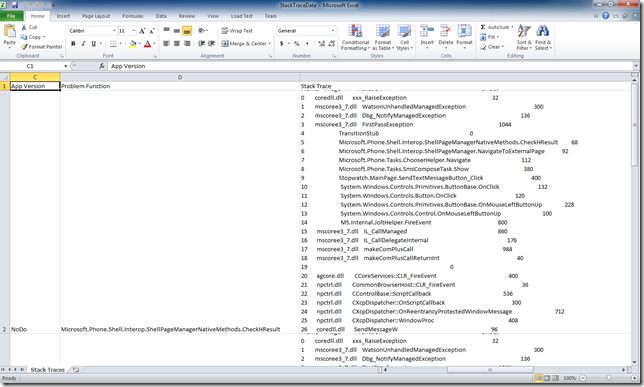
An example spreadsheet containing details of exceptions is shown here.
Microsoft Excel Spreadsheet containing exception details.
If you then download the spreadsheet you’ll then be able to access the level of detail necessary to further investigate the exceptions behind the crashes such as the exception message and associated stack trace.
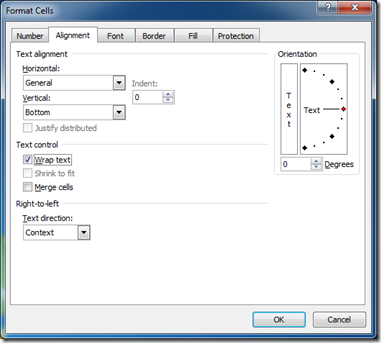
You’ll most likely want to explore the stack traces of exceptions and therefore you’ll want to enable the Wrap text option (see below) for that column within the spreadsheet.
Microsoft Excel Format Cells allows the stack trace to be more readable if the Wrap text option is enabled.
With the Wrap text option selected the stack trace information is now more readable as shown in the following spreadsheet.
Microsoft Excel Spreadsheet containing exception details.
