Why override ToString()? Use DebuggerDisplayAttribute instead
Debugging and Runtime Inspection
The Visual Studio 2010 debugger is an awesome tool, no doubt about it. It's likely the most powerful and capable debugger ever developed for Windows or any other platform. And yet, there are times when you wish it 'knew' or exposed more detail. When you're debugging a runtime instance of your application or inspecting a mini-dump to gain insight into the state of your application, often the most useful details are the values of the variables that characterize the state of your app at that particular moment. Or if you unwind a stack trace and wish to see the state of objects prior to the call that failed, you may be disappointed by the lack of simple exposure to object state displayed in the hover-tooltips by default.
When you're inspecting the state of an application while debugging and drilling down on your own type instances, or inspecting 3rd party assembly/DLL exposed types, the experience is likely a bit less than intuitive or optimal.
Imagine this situation, you've definately encountered it but probably never realized you had any power over the situation... You're stopped on a breakpoint in the debugger and using the mouse to hover over variables in the debugger - you're depending on the Visual Studio hover-tooltips to inspect various instance or static variable values in order to build a mental image of the state of your application.
Often times you wait for the popup window, then you start clicking on the '+' signs to dig deeper, but then your mouse cursor drifts off the tolerance gap of Visual Studio and the inspection pane disappears! Or you get lucky and after clicking enough you get to inspect the value of properties within an array of object instances, or subordinate to the particular object you happen to be inspecting. But you have to click a whole-bunch-of-more-times to inspect the other instances of your type in a collection/array...
With simple native types VS quickly displays useful runtime value information. If you hover the mouse over an int or a double you will be quickly presented with the instance value. As well, with complex types that Visual Studio is already aware of you will see similarly useful inspection details exposed.


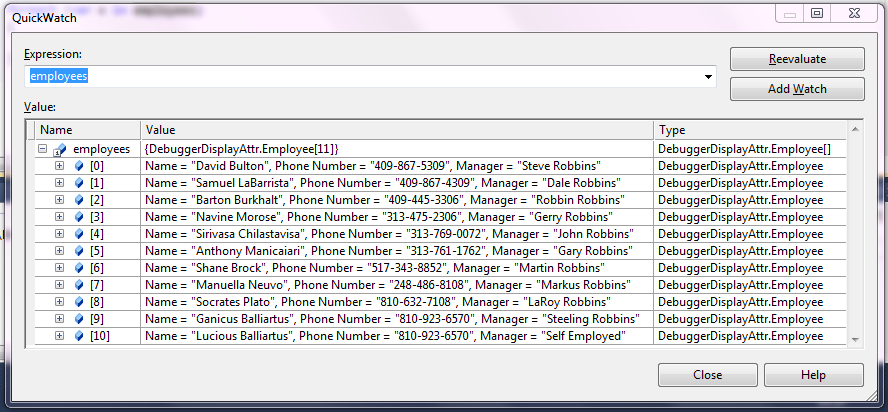
But with our own types or 3rd party types, often times all we see is the Type name. You can see by the declaration of the employees array below that each employee has distinct details that would be valuable to discern at runtime when debugging. But observe the Value column in the QuickWatch snapshot just below the employees array declaration - it simply displays the facts:
- there's 11 items in the collection
- the value of each is {DebuggerDisplayAttr.Employee}
Not very useful! To discover more you will have to start aiming and clicking on little plus-signs and stuff...

Again, to actually discover the values and build our mental state we have to drill down into each entry by expanding the '+' to expose deeper details. Frequently multiple levels of inspection are required to find the information we need to elucidate our mental image and derive practical benefit from our debugging exercise...
Just add a ToString() implementation...
There's a couple of options available to programmers to resolve this 'problem':
You can override the Employee object's ToString() method to expose a hard-coded, specific view of the internal state of your object instance... "Let's just add a ToString() implementation" you say - we all know that's how to expose details that the debugger recognizes. Let's see what happens...

The debugger now leverages the ToString() conversion to display the runtime instance values in our array:

This seems like a much better situation. Now when we expand our array in the debugger we see useful instance information. But it is not ideal. Let me explain: you may have a need to use ToString() for UI purposes that differentiate it from the debugging experience. Or you may have no need to declare ToString() at all on your objects, as you don't intend to render them to the UI via string casts...
There's a better way
Wouldn't it be much more useful if the debugger provided the distinct details regarding each instance in the employees list, but did so in such a way that we could implement ToString() for an object for UI display purposes, or completely disregard the need to even implement a ToString() method... And what if we could do it declaratively? As you'll see in a later post we can describe our inspection format declaratively... but in this post I will strive only to differentiate ToString() from the debugging inspection experience.
Why not just leverage the ToString() override?
For one thing, it will affect every situation where an object's instance is converted (i.e., casted) to a string - this may not be what you want. It may even conflict with your requirements! For example, you may actually need a richer (or poorer) implementation of the ToString() override to fill in a list box or write to the active window of your application. Or if that's not the case, you'll find that doing this extra, hard-coded work is overkill - maybe all you want is debugger exposure and clarity!
If clarity is your goal there's a better, more dynamic solution.
The DebuggerDisplay Attribute
By leveraging the DebuggerDisplayAttribute you can specify the display format for your object instance to the debugger. And what's more, while you can do this in the code with a simple attribute declaration, there's a way to deliver this type-exposure information to Visual Studio in a way that it recognizes and utilizes for non-native types on the fly. You don't have to modify your code, and if you want to modify what's exposed you can do so outside the context of your application (i.e., no rebuild of your app, no re-deploy, no approvals...).
And that's not all! In my next post I will tell you how you can use this facility to expose details of 3rd party type instances that you wish to inspect in the debugger, that may not already implement a useful ToString() method, let alone a DebuggerDisplayAttribute!
First, let's see how to accomplish this in our code. It's straight forward:
 namespace DebuggerDisplayAttr
{
     [DebuggerDisplay("Name = {Name}, Phone Number = {PhoneNumber}, Manager = {EmployeeManager}")]
    public class Employee
    {
        /// <summary>
        /// Properties
        /// </summary>
        public string Name { get { return new StringBuilder(FirstName).AppendFormat(" {0}", LastName).ToString(); } }
        public string FirstName { get; set; }
        public string LastName { get; set; }
        public string PhoneNumber { get; set; }
        public int ManagerId { get; set; }

        public string EmployeeManager { get { return LookupMgr(ManagerId); } }

        /// <summary>
        /// Accessor that accepts an ID and performs a lookup via the Manager class
        /// </summary>
        private string LookupMgr(int id)
        {
            return Manager.Find(id) ?? string.Empty;
        }

        public override string ToString()
        {
            return string.Format("Name: {0}, Phone Number: {1}", Name, PhoneNumber).ToString();
        }
    }
}
The key detail above is the DebuggerDisplay attribute declaration. It specifies the instance display format in metadata that the debugger recognizes at debug-time. You can leverage properties, fields, methods... anything declared in your class - note: the debugger doesn't differentiate between access modifiers - private, protected, and public fields, properties and methods are all fair game for use in this exercise.
For example, the attribute declaration leverages the EmployeeManager property, which is resolved via a call to the Manager object's Find() method... details not shown here but obviously a complex method and one who's output enrichens our debugging experience. And you might also notice that I've also left in place the ToString() method on the object.
But let's look at the inspection output in the debugger now...
Hmmmm, perhaps my demonstration is underwhelming. But if you look at the code and what's going on, you'll see the advantages of this approach. The Visual Studio debugger gives precendence to the DebuggerDisplayAttribute declaration when inspecting instance values. Conversly, at runtime, when converting your object to a string for display on a form or casting it to display its value in a window, there's no knowledge of the DebuggerDisplayAttribute declaration; Precedence falls to the ToString() declaration.
Some details to observe...
The [DebuggerDisplay(...)] attribute is in the System.Diagnostics namespace, so you'll need to declare the following in your entity/DTO class:
using System.Diagnostics;
You can leverage composite properties in the attribute declaration... see the {Name} property for example.
You can utilize lookup methods on subordinate properties to resolve string values... the {EmployeeManager} property is an example of this technique.
In case you are not aware of this detail regarding attributes, [DebuggerDisplay(...)] is equivalent to [DebuggerDisplayAttribute(...)] as far as the csharp compiler is concerned... it resolves the declaration either way as long as the namespace is referenced and declared in a 'using' statement.
But what's the catch?
There's always a catch, right? Think about the performance implications of the work that's performed by VS as a result of leveraging this technique... the debugger has to re-evaluate the attribute expression every single time it encounters an instance of your object. Depending on how you construct the display string, this could cost you! If you have 10,000 items of your type in a collection or array you're going to experience latency as the debugger resolves (evaluates) the display criteria for your type when you access the hover-tooltips and expand your collection, when you add your collection to a Watch Window and expand it, or when you access your collection instance in Quick Watch and expand it. That's why they decided to call ToString() in the first place! It's a single method that's already included on every object by definition. It's compiled, optimized, and executed quickly on every type instance.
Here's a link to some best practices regarding the DebuggerDisplayAttribute (courtesy of Juozas Kontvainis). I think these have to be tempered with you're own justifications and awareness of how you use the types for which you're declaring display details, but these guidelines were gained from experience and are worth considering.
Okay, that was simple...
Well now the fun really starts! see my next post, Dynamic DebuggerDisplayAttribute, to find out how you can accomplish this without any code at all. And as I mentioned above, you can use the following technique to modify the inspection visibility of 3rd party types as well.
Comments
Anonymous
April 05, 2011
You might want to read DebuggerDisplay best practice recommendations: blogs.msdn.com/.../debuggerdisplay-attribute-best-practices.aspxAnonymous
April 06, 2011
Juozas, thanks for sharing the link! I can see the points made are valid. I like the idea of using a property to encapsulate the formating to avoid the eval penalties. I think also the point is importantly made that depending on the way your objects are used in your app, you may or may not run into the negative debugger performance characteristics described in the article. Kind regards! ScottAnonymous
April 06, 2011
I have used the DebuggerDisplayAttribute, but prefer to override the ToString method as I use it for tracing also. It’s a simpler solution.Anonymous
April 08, 2011
ToString is used by most list/display controls that take an object for an item. So I often have ToString filled out regardless. However I can see the use by wanted a simple display for the list, but a more detailed display in the debugger.Anonymous
June 14, 2011
The catch is that the default ToString does not seem to utilize DebuggerDisplayAttribute. ToString is very useful when tracing/logging. So you end up needing both. Or just ToString.