Monitoring Azure Analysis Services with Log Analytics and Power BI
How do you monitor Azure Analysis Services? How many users are connected and who are they? These are great questions to understand around your AAS environment. While metric data is exposed via the Metrics blade for Azure Analysis Services in the portal, it's a quick means to answer these questions. What if you wanted to combine this information with other operational data within your organization? Especially around the area of QPU (or query processing units, which is how AAS is priced). While extended events work in Azure Analysis Services, parsing the resulting XML files into human readable form is cumbersome, difficult, and time consuming. Just as many aspects of the cloud should require some thought process into how systems are designed, it's prudent to rethink the monitoring aspect as well. By using Microsoft Log Analytics, it's possible to build a complete monitoring solution for Azure Analysis Services with a simple Power BI Dashboard that can be accessed along with the rest of needed operational information for system administrators. Log Analytics provides near real-time data exploration for telemetry. There is a great reference here from Brian Harry. The remainder of this post serves to detail setting up this process. One of the elegant approaches of this solution is that once it is set up, apart from the refresh of the power bi report no maintenance is required between the azure analysis services and monitoring step (as opposed to extended events). Without further delay, let's look at the steps required.
- Create a Log Analytics instance in your Azure subscription
- Configure Azure Analysis Services to send event and performance data to the log analytics instance
- Using Log Analytics as the data source, report on the data from Power BI
As the first step in the process, the first item we need to create is a Log Analytics instance, which is a part of Microsoft OMS (Operations Management Suite). For anyone unfamiliar, OMS is essentially Bing for your telemetry analytics data. For more information, see this "What is Log Analytics" page on the Microsoft docs. In the Azure portal, simply select "Create a resource", and then type Log Analytics:
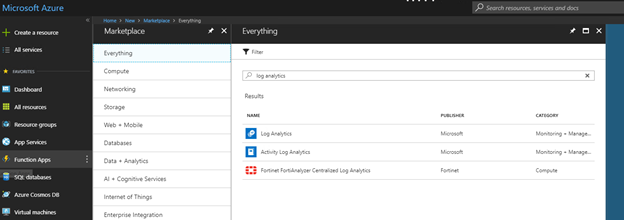
After clicking Create, select to either use an existing OMS workspace or to link to an existing one within the tenant. Choose to either use an existing resource group or create a new one, and then specify a location. Finally, select the pricing tier and click Ok:
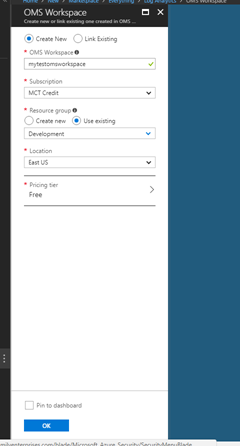
Once this is complete, you'll be presented with the OMS workspace node, which is essentially just a summary page. For now, just leave it as is. Next up we'll configure the magic. One of the major benefits of OMS is the ability to configure both on prem machines to forward information to Log Analytics, or to configure PAAS applications to transmit data, and what's what we'll do here. The doc is relatively straightforward, and the only issue that I encountered when setting it up was that my subscription did not have the Microsoft.insights namespace registered for my subscription. Below is the complete PowerShell Script that I ran against my sub utilizing the script outlined in the Microsoft docs:
[code lang="powershell"]
##followed the blog post outlined here: https://docs.microsoft.com/en-us/azure/log-analytics/log-analytics-collect-azurepass-posh
##save the azurermdiagnostic script locally that is saved on the powershell gallery.
#save-script -Name Enable-AzureRMDiagnostics -Path "C:\PowerShellScripts\"
##create a connection to azure
#Login-AzureRmAccount
##install any modules that don't already exist
Install-Module AzureRm.Insights
Install-Module AzureRM.OperationalInsights
Install-Module AzureRM.Resources
Install-Module AzureRM.Profile
##check and see the current state of the provider namespace for microsoft insights
#Get-AzureRMResourceProvider -ProviderNamespace Microsoft.Insights
##register it if needed
#Register-AzureRMResourceProvider -ProviderNamespace Microsoft.insights
##run the saved script from earlier
C:\PowerShellScripts\Enable-AzureRMDiagnostics.ps1
#Step 1. select the subscripton where the paas offering resides
#Step 2. SElect the resource type that you wanto to send to azure. in this case, find the resource type for Microsoft.AnalysisServices/servers
#step 3. Provide the  category of logs to process or type ALL.
#allow the script to run.
While running the script, note when it asks for the category of logs to track. For Azure AS, there are 2 options: Engine and Service. The Engine category is what traditionally would be tracked under either profiler or extended events, and the Service category is used for monitoring and tracking traditional perfmon counters (aka metrics).
Note that this "shipping" to Log Analytics is not instant. There can be a delay from what I've seen of anywhere from 5-20 minutes for the data to arrive. However what we are now presented with is a hassle free approach to analysis services monitoring! Next up is getting the data out of Log Analytics for reporting. Let's do that now.
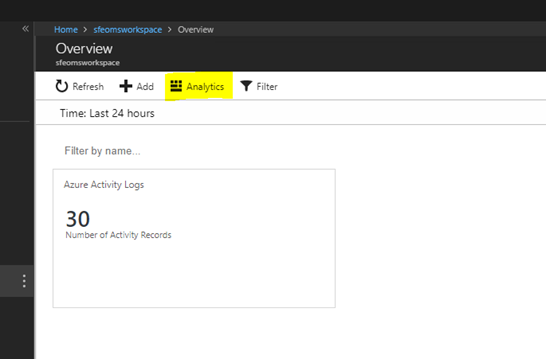
Back in the Azure portal, in the Log Analytics resource that was created earlier, open up the Overview Blade and then select Analytics:
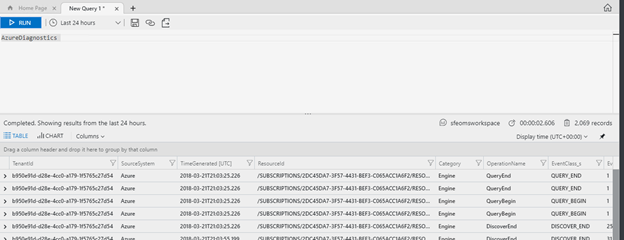
Once this window is open, the first screen presented to you is the Home Page which talks about getting started with AQL. Over on the left hand side of the screen notice the active pane, which contains a root of the oms workspace that you originally created and then a node for "log management". This is where your Azure AS data is being sent. Expanding that node, you see a list of all the tables that are a part of the log management object for Log Analytics. There are two primary tables we are interested in: AzureDiagnostics, which is where Azure AS sends the extended event data (aka engine); and AzureMetrics, which contains the metric data (aka service). In Log Analytics, the queries are built using a language native to the product. For example, to see everything in the AzureDiagnostics table just drop the table into the query window:
I've gone ahead and created two queries to pull the data out of the two tables:
[code lang="sql"]
//AASEvents:
AzureDiagnostics
| extend LocalTime = TimeGenerated -4h
| order by LocalTime desc
[code lang="sql"]
//AASMetrics:
AzureMetrics
| extend LocalTime = TimeGenerated -4h
| where ResourceProvider == "MICROSOFT.ANALYSISSERVICES"
| order by LocalTime desc
Running these queries results in the data that AAS has sent showing on screen. The next step is to export the data to Power BI. Fortunately Log Analytics again makes this easy:

The resulting file that downloads is a custom query that I can simply copy/paste into PowerBI! How cool is that! It also contains the header, credential information, and my query for me to pull in. After generating both of these for the two queries switch over and open up Power BI Desktop and paste them in via the provided instructions. Now as you follow the instructions and create your dashboard, don't forget about perhaps creating some additional insight by using the metrics descriptions that are published on the Microsoft docs page. You could simply point Power BI to this page and have it extract, however if you decide to go that route remember that Power BI does not currently at the time of this writing allow you to mix both online and "on-prem" data sources together for refresh in a single dataset. I chose the copy/paste method for my report. After creating the report, I wound up with something like the below.
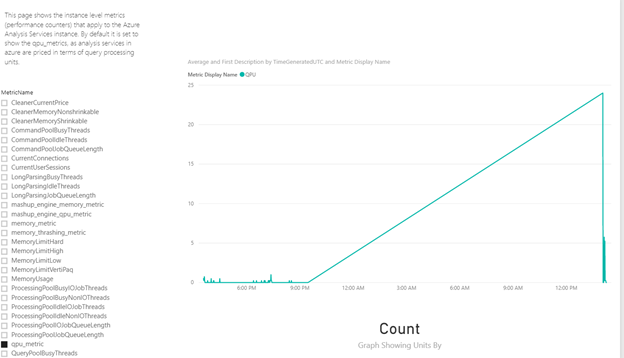
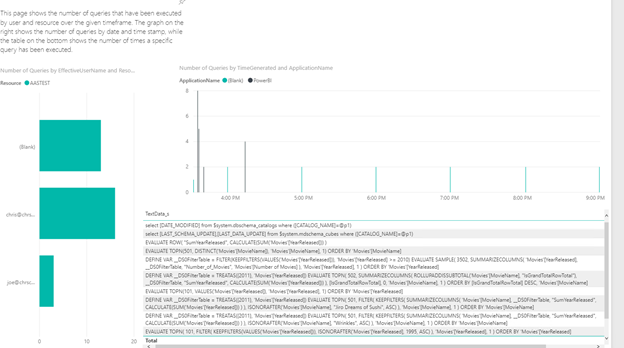
In a real world scenario, there should be some additional slicers to see by resource group and instance as well as what I have here. The sheer amount of information at your disposal regarding Azure Analysis Services performance is overwhelming. For this use case the interest was simply in who is running the queries and what kinds of queries are they running, but all of the information is available to perform in-depth performance tuning and analysis of the underlying engine, query tuning, etc. By scheduling periodic refreshes of the dataset within Power BI as well, we have an always up to date dashboard of usage in Azure Analysis Services. Consider some of the following scenarios that this dashboard could be used for:
- Dynamically pause/restart azure analysis services during times when there is no QPU activity
- Dynamically scale up/down an azure analysis services instance based on the time of day and how many QPU units are needed
All of these scenarios could be accomplished using the Azure Analysis Services PowerShell cmdlets.