SQL Diagnostics Project Part 1 – Configuring Custom SQL Data Collections
This blog post will be part 1 in a multi-post series where I show you how to create your own custom SQL Server troubleshooting data collections, how to load the data into a SQL Server database, and how to create your own custom reports based on the data you collect.
The first step in this process is becoming familiar with Diag Manager from CodePlex. This tool is practically identical to the pssdiag tool that we SQL engineers use to capture a data from a customer’s system. The tool comes with a simple UI that allows you to pick and choose which data to capture from a given SQL Server machine.
Note: You install and configure this tool from a client machine – not a target SQL Server machine. The tool will create a .cab file that you place on a SQL machine to capture information. The DiagManger tool is just used to decide which data you want to capture. It basically creates a configuration file for using SQLDiag. SQLDiag is a capture utility that comes with SQL Server – DiagManager is simply a UI used to create configuration files for SQLDiag.
This is a tool that has been out for a long, long time and I’m still amazed that it’s not used more.
The benefits of using DiagManager as your tool of choice for capturing SQL Server diagnostic data include:
1. It’s free. A great and flexible tool that won’t cost you a cent. No marketing included.
2. It’s easy to use. Once you get a feel for the interface after this post, you’ll be able to create custom configurations to capture data from any server in your environment. (More on this later)
3. It collects perfmon data. A lot of free tools out there don’t. Data gathered from perfmon can help you solve a number of problems that aren’t possible through DMV collections. Besides Wait Stats captured through DMVs, perfmon data is the first data I look at from a capture.
4. It’s completely configurable. You don’t like what data it captures by default? Change it. Under the covers this tool is basically creating configuration files for SQLDiag to use, so if you can imagine it – this tool can likely capture it. Great for consultants that like to use their own scripts, but want their customers to capture the data.
5. It collects SQL Trace data – which can be used in conjunction with perfmon data to correlate interesting events that occur inside the database engine.
6. It is a consistent troubleshooting solution that will collect the same data from each server for evaluation purposes.
Getting Started
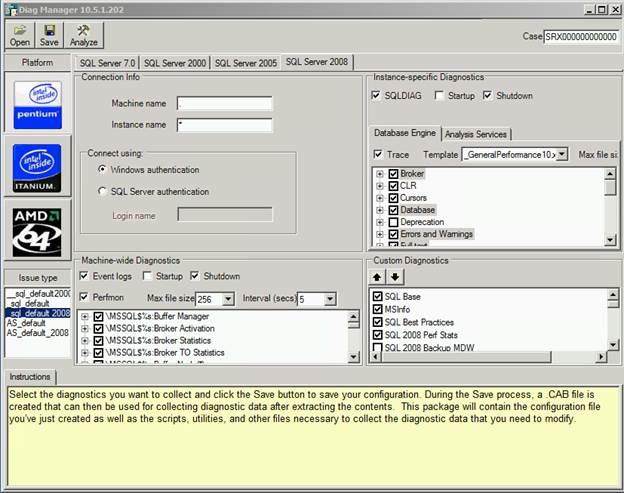
Once you have downloaded the installed the tool from CodePlex onto a client machine somewhere, open the tool to have a look at it. The screenshot below is what you’ll see. Let’s go through the UI;
The default CPU architecture selected is 32-bit (which is the first choice in the Platform list). More than likely you’ll be running this capture against a 64 bit server, so make sure to choose the AMD-64 button. If the target server is 32-bit, stick with the default. Also, make sure this is the first option you choose. Switching from 32 to 64 bit will undo all previous choices you’ve made for the capture. Not a huge deal – but can be frustrating. If you’re running this capture on a clustered instance of SQL Server, you’ll want to specify the SQL Virtual Name as the machine name. More information on this here: https://diagmanager.codeplex.com/wikipage?title=RunningCluster
If you plan to capture diagnostic information against all of the instances on the machine that the diag is captured, then you can accept the defaults here. Otherwise, specify an instance name if you only want to capture data against a single instance on the machine. You’ll have to execute the pssdiag this tool creates on the server itself, so leaving the Machine name input box as “.” should be fine. (This tool doesn’t allow for executing the pssdiag capture remotely) Also, make sure you choose the correct version of SQL Server that you plan to be capturing diagnostic data from. If you do not, the capture will error when you attempt to gather data, and you’ll have to start all over.
Unfortunately, at the time of this writing this tool doesn’t capture SQL Server 2012 information natively. I can’t say when the tool will be updated to allow for this through the UI. The batch file this tool creates can be adjusted to allow for capturing data from a SQL Server 2012 instance. I’ll outline how to do this in a future blog post.
One great asset of this tool is that gives you the ability to capture perfmon data. You are able to specify the objects that you want to capture along with the max file sizes and the capture interval (the capture interval is global across all perfmon counters). I always capture perfmon data – the overhead of the collection is minimal and it can really give you a lot of insight as to what is going on for a given server. It’s a wealth of information and can help you uncover problems that you wouldn’t be able to find with DMV information alone. And, if you wanted to, you could feed the output from the perfmon capture to the Performance Analysis of Logs (PAL) tool.
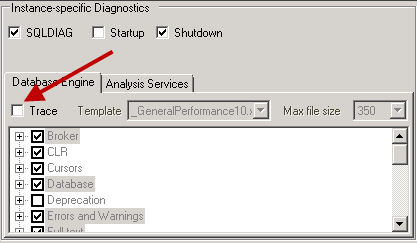
By default, DiagManager will capture SQL Trace information. However, only on rare occasions do I actually collect it. Capturing too many trace events can add a lot of overhead to an instance, and actually be detrimental to what you’re trying to accomplish overall. Uncheck this box if you do not need to collect SQL Trace data. If you do decided to collect Trace information make sure to collect only the information you need. If the capture runs for an extended duration, you’ll want to make sure you run the capture from a drive that has a lot of drive space.
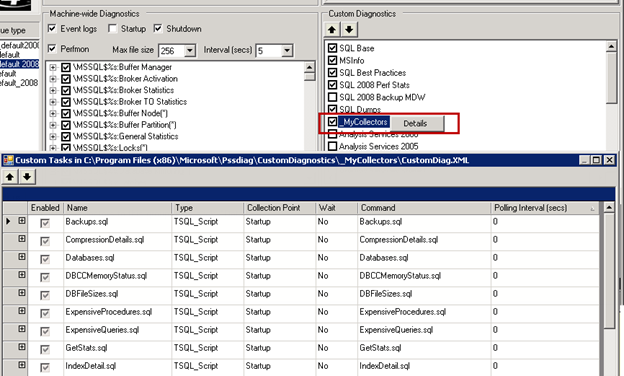
Now comes the fun part – the custom data collection. From my perspective, this is the most powerful portion of this tool as it allows you to collect data from any custom SQL script you could imagine. To enable, right-click “_MyCollectors” and choose “Details”. From there, a screen pops up that allows you to configure the collection to gather your personalized scripts.
I’ll say that again – whatever scripts you find handy, you can have pssdiag capture them for you. Any script you want. The output of these SQL scripts will be dumped to .OUT files, which can be analyzed by other tools, namely SQL Nexus (which I’ll cover in depth in my next blog post).
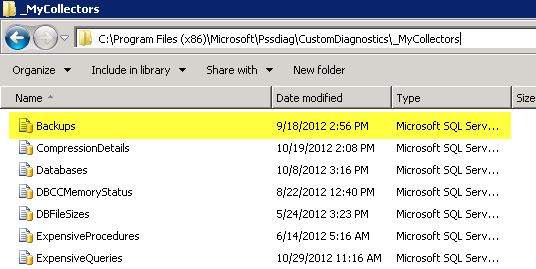
If you have a lot of scripts (and I do) then entering them in by hand may not be the most useful option for you. So, one option is to modify the XML that holds this listing of scripts directly. These values are stored in the CustomDiag.XML file in the C:\Program Files (x86)\Microsoft\Pssdiag\CustomDiagnostics\_MyCollectors folder.
To download the scripts that I send out for collection, you can grab them here. My plan is eventually have a communal location where people can post scripts that they find useful so others can make use of them as well. Everyone loves useful scripts, and having a central location for them would be great for everyone. If you have any comments on the scripts I’ve provided, please shoot me an email at timchap<at>Microsoft<dot>com. I’d love to have feedback, and in the future plan to put something together so people can post and review their own scripts for everyone to use.
You can edit this XML file directly to add your scripts.
You can download my CustomDiag.XML file here. You’ll just need to drop it into the location specified above.
You’ll also want to put your custom SQL scripts in the same location.
If you look at the scripts I’ve made available, you’ll notice a PRINT statement at the beginning of each one (and intermingled in some others) that describes the type of data that script is collecting. The output from the PRINT statement will be present in the output file that the pssdiag captures.
Why should you care? I’m glad you asked. ![]()
We will use these tags to identify data sets and load them into SQL Server tables automagically using SQL Nexus. (I’ll focus on how to do that in my next post.) If you setup a capture that gathers data at regular intervals during the process, it is also a good idea to inject a GETDATE() to the PRINT statement at the beginning.
After you’ve made your choices for the data to gather, click the Save button and choose where to place the pssd.cab file. It is this file that you will place on the SQL Server for capturing data. By default, this file is saved to the C:\Program Files (x86)\Microsoft\Pssdiag\Customer directory on your client machine. If you’ve chosen SQL 2008 as the instance you’ll be collecting from, you’ll get the following popup asking you whether you’re collecting from a SQL Server 2008 or SQL Server 2008 R2 instance. Choose the correct option for the instance you’re collecting from.
Note: Pay no attention to the typo in the screen above. It’s done on purpose for dramatic effect. ![]()
After you’ve placed the pssd.cab file onto your SQL Server machine (preferably in a dedicated folder – potentially with a lot of free disk space if you’re capturing SQL Trace information), double-click the cab file to extract the contents (double click the cab file, copy-all, and paste them somewhere).
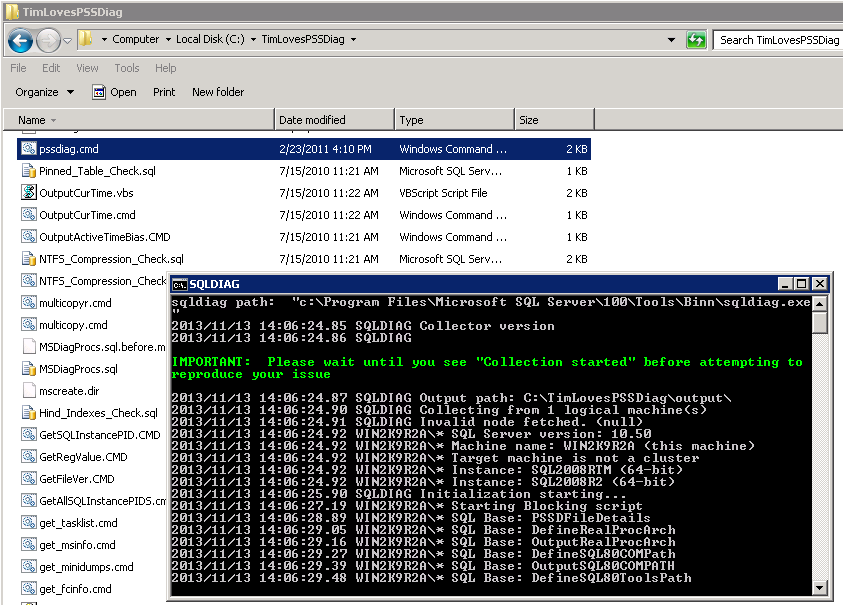
Double-click on the pssd.cmd file (shown below) to start the data capture. When you’ve ran the capture for a sufficient amount of time (that will depend on how long you think you need to capture the data) then hit Ctrl+C to stop the capture. If you’re just needing to snapshot the server to get a few vital bits of information, starting the capture and immediately shutting it down may be fine. However, if you need more information than that, running the capture longer may be necessary. It isn’t unheard of for me to have clients run the capture for several hours. If you do this, just be careful if you’re capturing SQL Trace information – as it can result in a large data capture.
Note: The capturing of this information can also be automated through the use of a SQL Agent job.
Once the capture shuts down, it saves the data to an output folder in the same location where you started the capture – in my case the C:\TimLovesPSSDiag folder.
Taking a look at the output folder we can see a glimpse of the breadth of data that this tool collects, both by default and through customization.
In my next post in this series I will detail how you can make use of SQL Nexus to import the custom data you collected through your DMV scripts into SQL Server tables. In the post after that I will introduce some custom reports that I have made from the data I typically collect from customer environments, and share a Powershell script that will export the data from those reports to an Excel file that will be very close to “Customer Ready”. This report will allow you to show to your customer’s specific issues they may be experiencing on their system. This way you can focus on planning remediation steps with your servers or your customers rather than worrying about gathering the data.
Here is the link to the downloads in case you missed the links above.
See you next time!
Tim Chapman
@chapmandew
Comments
- Anonymous
November 23, 2013
Excellent sample. Thanks for sharing
