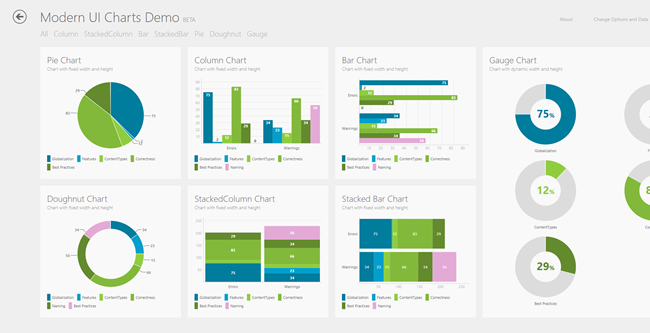
Free ModernUI Charts for WPF, Windows Store Apps und Silverlight published
Some days ago I have published a free library with chart controls which can be used in client applications. The library can be used in WPF desktop applications, in Windows Store apps and in Silverlight applications.
Download the binaries, source code and some test applications: https://modernuicharts.codeplex.com/
Or directly try them in the Silverlight application: https://www.mossblogger.de/charts/
Intention 1
I needed Modern UI Charts for my own application which should run on Desktop (WPF), Web (Silverlight) and Windows 8 devices and I didn't want to use 3 different third party charting components. That’s why I created the charts from scratch and used them in the tool “SharePoint Code Analysis Framework (SPCAF)” (https://go.spcaf.com/VSGallery) which I have developed with Matthias Einig.
Intention 2
I think that XAML is the greatest way to "describe” the UI of an application via a markup language. I don’t want to miss things like data binding, styling of controls, data templates, animation of state changes, easy re-use of custom controls, design support with Blend and many more. I don’t hope that HTML5 and JavaScript are the only future for our UIs. That’s why I wanted to discover how the same XAML could be used “cross-plattform” in WPF, Silverlight and Windows 8. For the charts I wanted to use as much as possible of the same XAML code which is available on all these plattforms. So finally the code for the charts uses the lowest common XAML subset of all three worlds. Check out the sample application in this project and see how it works.
Features
Dark Layout

Custom Color Palette e.g. with gradients, mono chrome

Comments
Anonymous
May 07, 2013
Your work looks wonderful! Will there be a Windows Phone port, too? :)Anonymous
May 09, 2013
Thanks. WP8 is in the works for next releaseAnonymous
May 11, 2013
Great. And HTML? :-)Anonymous
May 12, 2013
A HTML version is not planned. See paragraph "Intention 2" in this post :-)Anonymous
May 16, 2013
Great work. cheers!Anonymous
June 02, 2013
The comment has been removedAnonymous
June 03, 2013
Nice charts, great work! I'm testing them but I can't refresh a ClusteredColumnChart when I try to add new series in runtime. Does any existing way to do that? I'm trying with the next code: viewModel.Series.Add(new SeriesData() {DisplayName = "Text", Items = An ObservableCollection<TestClass>() }); Thank you!Anonymous
June 13, 2013
The comment has been removedAnonymous
June 13, 2013
The comment has been removedAnonymous
July 09, 2013
The comment has been removedAnonymous
July 10, 2013
The comment has been removedAnonymous
July 17, 2013
Absolutely awesome work Torsten, just a naive question Is this royalty free? Thanks.Anonymous
July 18, 2013
The charts can be used totally free. They are published under Microsoft Public License which grants you these rights.Anonymous
July 25, 2013
Hello Torsten, try just using the gauge chart as a web silverlight object but still no success :( any advice to make this possible? Thank you very much.Anonymous
August 04, 2013
Hi, can you run/use this with 4.0 framework or does this require 4.5?Anonymous
August 25, 2013
The comment has been removedAnonymous
October 24, 2013
If the name is same it is displaying only one name data in the graphAnonymous
October 29, 2013
Awesome work.. Thanks..Anonymous
November 18, 2013
I have been using modern ui chart controls.the following is the namespace "xmlns:chart="using:De.TorstenMandelkow.MetroChart" " <chart:PieChart Width="1063" x:Name="pie" Height="518" Margin="0,69,10,0" HorizontalAlignment="Right" VerticalAlignment="Top" ChartSubTitle="Chart with fixed width and height" ChartTitle="Minimal Pie Chart " RenderTransformOrigin="0.331,0.503" > <chart:PieChart.Series> <chart:ChartSeries DisplayMember="Name" ItemsSource="{Binding Path=Errors}" SeriesTitle="Errors" ValueMember="Amount" DisplayMemberPath="Name" /> </chart:PieChart.Series> the above is the xaml code of pie chart.now iam using observable collection to display the data into pie chart public class AViewModel { public ObservableCollection<TestCase> Errors { get; private set; } public AViewModel() { Errors = new ObservableCollection<TestCase>(); using (var db = new SQLite.SQLiteConnection(App.DBPath)) { var query = from i in db.Table<Sd_A>() select i; foreach (var _A in query) { Sd_Sub_Category subobj = SubCategoryViewModel.getId(_A.SubCategoryId); var A= new TestCase() { ID= _A.Id, Name = subobj.Name, Amounts = Convert.ToInt32(_A.Amount), }; Errors.Add(A); } } } } iam calling this collection from my .cs file in this way this.DataContext = new AViewModel.aViewModel(); from the above line the data is getting displayed in pie chart.in my collection Name is having same name with multiple times ie amair,amair,rahul,rani .iam getting only amair,rahul,rani in pie chart instead of amair,amair,rahul,rani. i want to display the complete the data from my collection even the name is repeating.please let me know where i need to change my code to solve the issue.Anonymous
November 27, 2013
Hello Torsten, Is there any possibility to Decrease Height and Width of RadialGaugeChartAnonymous
January 02, 2014
Great controls - any plans to support a surface chart in WPF like this one www.nevron.com/.../triangulated-surface-chart.png ?Anonymous
January 21, 2014
The comment has been removedAnonymous
March 06, 2014
As owner of Gigasoft, I love the ridiculous "Great Controls" plug and bad link of Nevron's, but if researching or interested in WPF Charting, and want to see an impressive 7 meg demo seconds away, and it will have you wondering how all that got in 7 Meg, yes see http://www.gigasoft.comAnonymous
March 07, 2014
if you want to use pure xaml then least common denominator can do the job. but if you have to code, then you will see that Wpf, silverlight and win8 have nothing in common. what if you want to develop for mac? xaml is dead outside of the MS domain - it will never run on android too. So looks like Html 5 is here to stay. if you need aomething equally powerful on C# check out Nevron Open VisionAnonymous
March 17, 2014
Hello. I like the charts you created. They look awesome. When LineChart will be released?Anonymous
April 02, 2014
Hello Sir Can we Use these Chart in windows phone 8 Application..Anonymous
April 05, 2014
Excellent work ... we'll see when calculating the candidate version? I'm tried a graph with three series of bars but different series ranges are not properly accommodated. Greetings ...Anonymous
April 08, 2014
The comment has been removedAnonymous
April 11, 2014
It'a anything else but modern - look's like win3.1 with 16 colors.Anonymous
May 03, 2014
The comment has been removedAnonymous
May 05, 2014
Is this work on .net framework 4.0?Anonymous
May 29, 2014
The comment has been removedAnonymous
June 15, 2014
The comment has been removedAnonymous
June 18, 2014
The comment has been removedAnonymous
June 19, 2014
Maybe you can support a Xamarin.Forms controls.It's great. Because only code once and run three mobile platformAnonymous
July 21, 2014
The comment has been removedAnonymous
September 13, 2014
Have you released this UI NuGet for Windows Phone 8?Anonymous
September 17, 2014
Awesome work toresten...!! I just want to know is there any way to decrease the size of RegularGaugeChart? I am unable to that.Anonymous
September 26, 2014
The comment has been removedAnonymous
November 09, 2014
Awsome resource these charts. Looks really nice :) Area charts would be included at some point in time?Anonymous
November 13, 2014
Hello mr. Torsten Mandelkow. you say "WP8 is in the works for next release" i have only one question - when you planning make next release?Anonymous
April 08, 2015
The comment has been removedAnonymous
June 16, 2015
The comment has been removedAnonymous
October 27, 2015
The comment has been removedAnonymous
November 27, 2015
The comment has been removedAnonymous
January 27, 2016
I was hoping to get better performance from a WPF Chart. There's a WPF Chart control that'll support millions of points. Do you have any plans to support something like this? http://www.scichart.com/