Azure Log Analytics: Disk Space Usage–Part1
Often for customer demos I show this particular example or get questions as its pinned to my Azure Dashboard – its the first thing you see.
UPDATE 17th May 2018: I’ve now added a Part 2 to this post, please go here for that
Performance counters are a great sources of performance data obviously, but also has some other data points such as % free space. You will need to check you have this counter in your OMS workspace, if not you can add it under Advanced Settings – Data – Windows Performance Counters
If you run, this query you will either get the data or find you need to add the counter:
Perf
| where ObjectName == "LogicalDisk" and CounterName == "% Free Space"
The full query makes use of the summarize command to get the minimum space %. I then look at the InstanceName table to get the specific drive letter. I wanted to ignore the other types of disk space that InstanceName holds, so I used strLen to achieve that (by just showing 2 character only entries like c: d: e: etc…).
Perf
| where ObjectName == "LogicalDisk" and CounterName == "% Free Space"
| summarize FreeSpace = min(CounterValue) by Computer, InstanceName
| where strlen(InstanceName) ==2 and InstanceName contains ":"
| where FreeSpace < 20
| sort by FreeSpace asc
| render barchart kind=unstacked
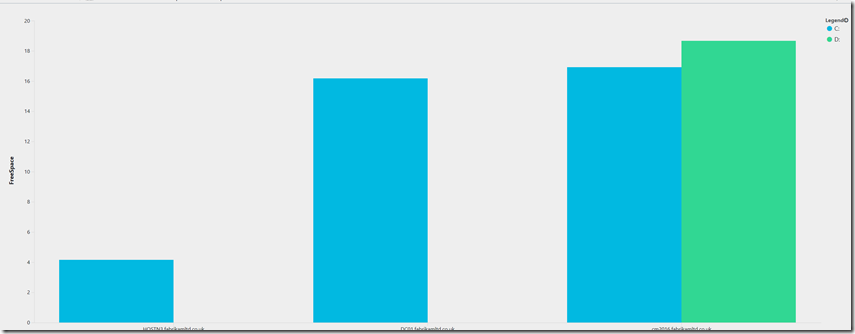
I show all all servers will ‘%Free Space’ of less than 20% – you can adjust this to suit. I’ve chosen to show this as a bar chart.
Output example:
