PerfMonitor runAnalyze: A quick performance 'checkup' for your managed App
About two years ago now I wrote part 1 and part 2of a MSDN article entitled 'Measure Early and Measure Often for Good Performance'. In this article I mention some 'perf mantra' which is that
- Every application deserves a 'perf plan' (which and be trivial if you have trivial performance needs)
- That you need to measure.
Well, that second point (measuring), has never been as easy as you would like it to be. However we do keep trying.
As part of this effort the CLR team has posted a useful tool, perfMonitor, on its codeplex site https://bcl.codeplex.com/.
PerfMonitor is a application that can both collect performance data and create performance reports on managed (and unmanaged), applications. It was designed to streamline the common case. Lets assume you have an application called 'MyApp' and you wish to measure its end-to-end performance. It is as simple as running the command
- PerfMonitor runAnalyze MyApp
If the app is interactive, you can interact with it and force it down the code paths you are interested in. When the application completes, PerfMonitor will create a report. Information in the report includes
- Total stats (total clock time consumed etc)
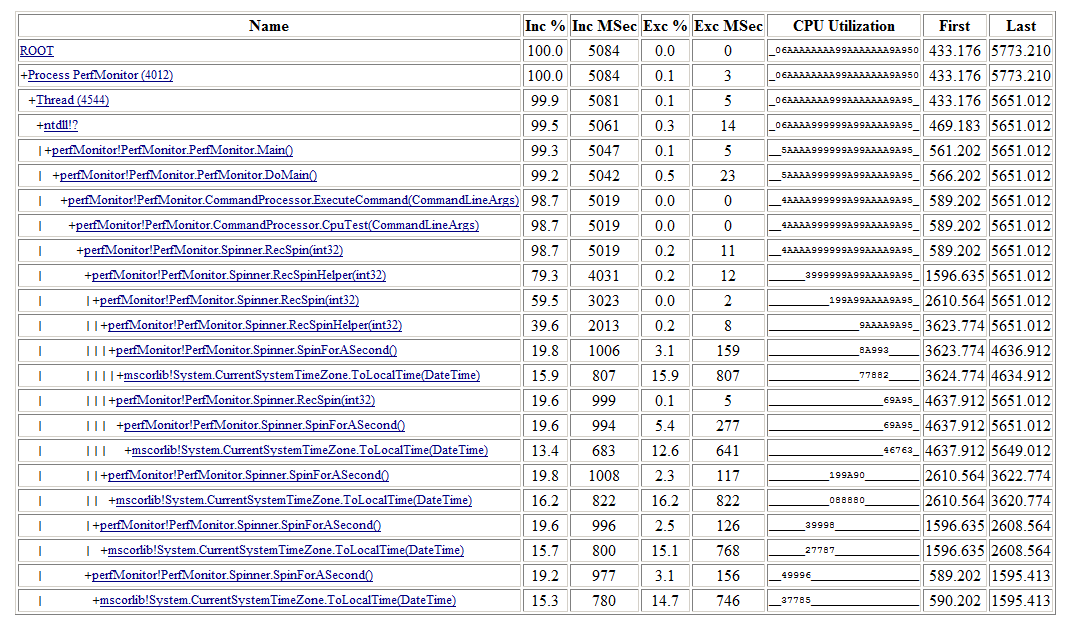
- CPU statistics, brown down by call stack. For example below is the report for a tutorial example included with PerfMonitor, If your app is interactive, it is likley to have 'spurts' of CPU activity, and to tool allows you to see these spurts in the timeline (and in fact focus on just that region if you so desire).
- GC statistics of your application (How much memory are you consuming (See Memory Usage Auditing for .NET Applications for more on interpreting this data).
- Just in Time (JIT) compilation statistics. This information is useful in determinging if you could improve the startup of your application by pre-compiling your appliction with the NGEN utility.
PerfMonitor tries to be helpful along the way, highlighting unusual performance data, and trying to put the data that it does in perspective. The goal is that simple performance problems can be isolated in minutes, and harder problems are possible. Because it is so easy to deploy and run PerfMonitor and look at the first level analysis, you really have to ask yourself 'why not'?
Interested?
Another useful aspect of PerfMonitor is that it is REALLY easy to deploy. It is a single EXE that requires no installation (just copy it to your machine and you can run it (It does require Vista OS or better). To get it
- Go to perfMonitor site (or go to https://bcl.codeplex.comand search for PerfMonitor)
- Click on the 'download page' link in the 'See aso' section
- click on perfMonitor.bin.zip link
- Read and accept the conditions of use, it will download the perfMonitor.bin.zip. Click in the 'open' button to open the ZIP
- If the browser brings up a security dialog, allow the opening of the zip.
- Use explorer to bring up a directory to copy perfMonitor into (eg Documents).
- Drag perfMonitor.exe to the target location.
You can also simply double click on the perfMonitor.exe from either the ZIP file directly or wherever you copied perfMonitor to. This will bring up the users guide, which will explain the features in detail.
This is only the begining...
Over the next several weeks I will be posting more about perfMonitor and how to use it to help build high performance applications. It is really just a (simple) front end on powerful performance monitoring technology built into windows called Event Tracing for Windows (ETW). This is the same technology that the Windows team uses almost exclusively for its performance work, and is the basis for their VERY useful XPERF tool. Because of this, PerfMonitor and XPERF can interoperate on the SAME wealth of performance data that the operating system can collect for you.
There really are very few performance problems that the OS does not ALREADY capture the information needed to do an efficient analysis. The key is having tools t display it and some basic knowledge that will guide you through the data. This will be the subject of future posts....
Comments
Anonymous
August 02, 2010
I get: Exception: System.DllNotFoundException: KernelTraceControl.dll missing from distribution. What am I missing? I have the .NET framework 4 installed and I can see that PerfMonitor.exe created that DLL when I ran it.Anonymous
August 17, 2010
I am also getting the same error as ChrisF, I have both .net 3.5 and 4 installed.Anonymous
August 23, 2010
Hey, Would you please update as how can I use this for ASP.NET pages and webservices please Thank you, AmritaAnonymous
August 20, 2011
Hi, I used the tool to get some insight in the startup time of my application. The tool reports some interesting figures wrt. the time spend on JIT compilation. According to the tool the overhead of the 64-bit JIT compiler is 3 to 4 times higher then the 32-bit JIT compiler. I did not expect the gap to be this big! Is this what you would expect? Is there a benchmark comparing both JIT compilers? Regards, TomAnonymous
August 22, 2011
The 64 bit JIT compiler is indeed signficantly slower than the 32 bit JIT compiler. Of course the exact difference depends on the attributes of the methods being JIT compiled, but your numbers are not unexpected. Note that if JIT compilation is an issue for you the best responce is to NGEN your application. THis eliminates the overhead completely (nothing beats zero).