Troubleshooting a simple error message using FREB
FREB (Failed Requests Tracing – formerly known as Failed Request Event Buffering) is one of the nicest features released with IIS7 which would come in handy during troubleshooting. It does request based tracing, and produces a log file (in .xml format) that shows events and notifications from the various modules that worked on the request during its lifecycle.
This is going to be a series of posts talking about using FREB during troubleshooting various scenarios. In this blog post, I’m going to cover few scenarios like troubleshooting a specific error message, and what to look for in the FREB output.
Troubleshooting a simple error code
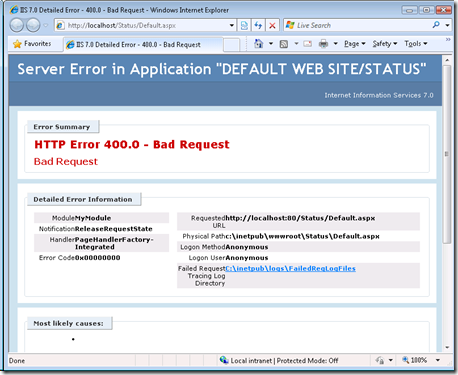
First, let’s take an example of troubleshooting a simple straight forward error code – HTTP 400 Bad Request. Whenever you get HTTP 400 Bad Request, the first thing to check is to find out where the HTTP 400 is logged – is it in IIS W3SVC logs, or in the HTTPERR logs. In this example, it would be in the W3SVC log, and that tells us that the request is actually processed by the IIS pipeline, and returned with HTTP 400 to the client. Only if the 400 is in IIS logs, we would be able to use FREB for the troubleshooting. Below is the sample screenshot of the error message (when browsed from the server itself – using localhost):
Let’s follow the step 1 in this article to create a FREB rule (create for HTTP 400 error message) on that website, or application. Below is how my web.config section with a FREB rule for 400 Error code (under <system.webServer> section) look like:
 <tracing>
  <traceFailedRequests>
    <remove path="*" />
    <add path="*">
      <traceAreas>
        <add provider="ASP" verbosity="Verbose" />
        <add provider="ASPNET" areas="Infrastructure,Module,Page,AppServices" verbosity="Verbose" />
        <add provider="ISAPI Extension" verbosity="Verbose" />
        <add provider="WWW Server" areas="Authentication,Security,Filter,StaticFile,CGI,Compression,Cache,RequestNotifications,Module,Rewrite,RequestRouting" verbosity="Verbose" />
      </traceAreas>
      <failureDefinitions timeTaken="00:00:00" statusCodes="400" />
    </add>
  </traceFailedRequests>
</tracing>
Now, let us try to browse the page which gives you the HTTP 400 error message. Unless you have turned the IIS HTTP error pages ON, you should see the complete error message when you browse the page from the server itself. By default, IIS HTTP error pages are set to “Detailed errors for local requests and custom error pages for remote requests”. In my example, since it is a local request, and we can see the complete error message.
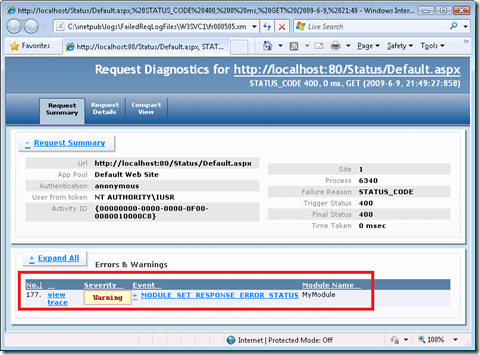
After browsing the page, you should see the FREB log file created under the %SystemDrive%\inetpub\logs\FailedReqLogFiles\W3SVC<#ID> folder. Below is how it looks after you open this. This is an XML file, and consumes a powerful freb.XSL located in the same folder.
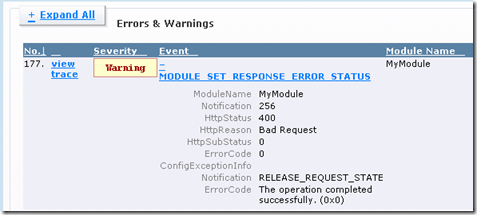
I’ve highlighted the part of the file which you should look at first. Under “Errors & Warnings” you will see the information about the event which in fact set the status of the response to what this trace has been triggered on. The interesting thing to look for is the “Module Name” which has set the status. In this case, we see “MyModule” as the Module Name. If you click on that entry, you will see more information about that event:
Click on the “Compact View” at the top, and you will find all the events which arose during the lifetime of that particular request.
As you see, this module has registered for the RELEASE_REQUEST_STATE notification, and it does set the Response status to 400 in its handler for that notification (In ASP.NET, it is context.ReleaseRequestState Event Handler).
So, now we know that this HTTP 400 is set by a managed module called “MyModule” and its class name is “MyBadModule” (see the trace entry #176). Now, you can go ahead and try debugging that module. In the future blog posts, I will try to cover some more troubleshooting scenarios using FREB.
Happy FREBing!
Comments
- Anonymous
June 12, 2009
I just wrote a blog post on my team blog on using FREB to troubleshoot a simple error message. I’ve taken


