Microsoft Edge (EdgeHTML) DevTools Protocol
Note
The Microsoft Edge (EdgeHTML) DevTools Protocol works only on Windows 10 April 2018 Update and later builds.
Developer tools can use the Microsoft Edge (EdgeHTML) DevTools Protocol to inspect and debug the Microsoft Edge (EdgeHTML) browser. It provides a set of methods and events that are organized into different Domains of EdgeHTML engine instrumentation.
Tooling clients can call these methods and monitor these events through JSON web socket messages exchanged with the DevTools Server hosted by Microsoft Edge (EdgeHTML) or the Windows Device Portal. Microsoft Edge (EdgeHTML) DevTools uses this protocol to enable remote debugging of a host machine running Microsoft Edge (EdgeHTML) from the standalone DevTools client available from the Microsoft Store.
The Microsoft Edge (EdgeHTML) DevTools Protocol is designed to align closely with the Chrome DevTools Protocol (see the W3C WICG for DevTools Protocols), though there are known interoperability gaps in this release.
Here's how to attach a custom tooling client to the DevTools Server in Microsoft Edge (EdgeHTML). See the remote debugging instructions if you're using Microsoft Edge DevTools as your client.
Launch Microsoft Edge (EdgeHTML) with the remote debugging port open, specifying the URL you wish to open. For example:
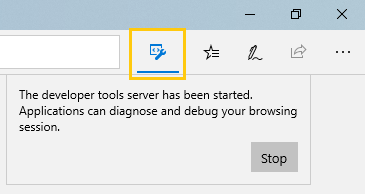
MicrosoftEdge.exe --devtools-server-port 9222 https://www.bing.comIf Edge is already launched, the URL parameter is optional. A button will appear next to the browser address bar to indicate the Developer tools server has started:

Use this HTTP endpoint to get a list of attachable page targets:
http://localhost:9222/json/listConnect to the listed
webSocketDebuggerUrlof the desired page to issue further protocol commands and receive event messages through the devtools socket server.
Version 0.2 of the DevTools Protocol provides new domains for style and layout (read-only) debugging and console APIs, in addition to the core script debugging functionality introduced in Version 0.1. In the Microsoft Edge DevTools UI, this translates to functionality available in the Elements, Console and Debugger panels.
Thanks for trying the Edge DevTools Protocol! We'd love to hear your feedback at:
EdgeHTML Issue Tracker: Protocol, DevTools, and EdgeHTML platform bugs and issues
Microsoft Edge DevTools Feedback Hub: Protocol and DevTools problems and suggestions through the Feedback Hub app
No, not simultaneously when the clients are debugging. The last client to connect will kick off the previous one. In the future when additional tools are supported, those will likely support simultaneous client connections.
No. You can specify any port, though be sure to pick one that isn't already in use. Port 9222 for remote debugging is used by convention.
See Using the protocol instructions above for attaching to Microsoft Edge (EdgeHTML) running on the local machine. If you're looking to support remote debugging, you'll need to devise a user workflow for installing the host machine's SSL certificate on the client, for example with an install dialog as Microsoft Edge DevTools Preview uses.
If I'm remote debugging using Edge DevTools, do I need to start the host browser process with --devtools-server-port cmd line switch?
No. If you're setting up remote debugging using Microsoft Edge DevTools Preview, the --devtools-server-port command line switch is not necessary for starting Edge. In this case, Windows Device Portal is hosting the DevTools Server on behalf of the browser.
The Edge DevTools Protocol currently supports only browser tabs. WWAHost.exe and webview processes are not supported.