Windows Server 2012 Troubleshooting: Printing
Introduction to Troubleshooting Windows Server 2012 Printing
Please feel free to update, add to, or add additional Troubleshooting articles to compliment this introductory article. Your troubleshooting insight and experiences are valuable to the community!
Troubleshooting Printing issues in Windows Server 2012 follows the same basic process as was used in Windows Server 2008 R2:
- Identify and then document the type of problem. Is the problem an inability to print any documents or only certain types of documents? Is the problem only seen with a specific application or when printing a specific document? Is the problem seen with only a V3 driver or only with a V4 driver?
- Gather information about errors logged or displayed to the user or admin. Gather screenshots from both the Print Server and the Client if possible.
- Enable logging and event channels for the Print Spooler and any other feature specific logs or event channels. If a new feature in Windows Server 2012 has a feature specific log then it will be discussed in the following sections.
- Reproduce the problem and gather relevant logs and troubleshooting data. In many cases, you will need to gather logs from both the Server and the Client.
- Troubleshoot the problem based on a review of the data and make relevant changes.
- Test to make sure the issue is resolved.
Tools for Troubleshooting Printing Issues
The following tools are commonly used to troubleshoot Printing issues in Windows. Each tool will be discussed in greater detail along with configuration steps for each specific troubleshooting scenario.
- Event Viewer
- Windows Debugging Tools
- Application Verifier
Logging Options
When you troubleshoot a printing issue, you should enable the log for the PrintService event channel.
PrintService Event Log Channel
The PrintService Event Log channel includes both an Admin and an Operational log. The Admin log is enabled by default, but the Operational log is not.
To enable the Operational Log, do the following:
1. Open Event Viewer
2. Expand Application and Services Logs\Microsoft\Windows\PrintService.
3. Right-click Operational and choose Enable Log.
Note: |
The PrintService Operational Log will log a great number of events on a busy print server and should only be enabled for troubleshooting purposes. Disable the log once troubleshooting is completed. You can increase the log file size if necessary to accommodate the amount of data you need to collect to troubleshoot your situation. |
More Information: |
Many of the events that will be logged in the PrintService channel are published online, including recommended troubleshooting steps for each event: |
Device Configuration Event Log
The Device Configuration Event log is enabled by default and is helpful when diagnosing printer driver problems. The event log is located at the following path:
Applications and Services Logs\Microsoft\Windows\Kernel-PnP\Device Configuration
Gathering Relevant Logs
The following logs are helpful in diagnosing any printing related issue:
Table 1: Relevant Logs
Log |
Location |
|---|---|
Setupapi.app.log |
%windir%\inf\setupapi.app.log |
Setupapi.dev.log |
%windir%\inf\setupapi.dev.log |
Setupapi.dev.log overflow |
%windir%\inf\setupapi.dev.log.YYYYMMDD_HHMMSS.log |
Setupapi.dev.log overflow |
%windir%\inf\setupapi.setup.log |
Windows Update Log |
%windir%\WindowsUpdate.log |
Device Config Event Log |
%windir%\System32\winevt\Logs\Microsoft-Windows-Kernel-PnP%4Configuration.evtx |
Troubleshooting the Print Subsystem
Overview
The Windows® print subsystem supports a wide variety of printer drivers, and although Windows Server 2012 introduces a new printer driver model, many Windows Server 2012 print servers will still use a large number of V3 drivers. Although this flexibility provides customers with a wide range of product options, the complexity and diversity of these options make it a challenge for system administrators and information technology (IT) professionals to debug a problematic configuration or identify the components that might be responsible for system instability.
This section describes the test and troubleshooting tools that can test the Windows print system that are available from Microsoft to system administrators and IT support staff. It also describes the procedures for testing and analyzing the information that these tools produce. You can use these tools and procedures to troubleshoot problems in deployed servers and to test printer and print server configurations before they are deployed.
The following are the general steps to test and troubleshoot the print subsystem:
Download and install the tools. Download and install Debugging Tools for Windows and Application Verifier (AppVerifier) on the computer that you want to test. For links to these downloads, see “Resources” at the end of this paper.
Configure the debugger. Configure the debugger and, if necessary, a remote debugging console to examine the problem and record information for later analysis by Microsoft Product Support engineers.
Configure AppVerifier.
Configure AppVerifier and Print Verifier for the type of test or tests that you want to perform.
Run the tests. Print the documents that cause the error or test the component or configuration.
Record and analyze the results. Record the results that AppVerifier produces. At this point, you can send this information to Microsoft Product Support engineers or analyze the information and continue troubleshooting.
Correct the problem and repeat the tests.
After you have found and corrected the problem, repeat the tests to make sure that those problems were not masking another problem.
Installing and Configuring the Debugging Tools
The debugging tools from Microsoft—such as the Windows debugger and AppVerifier—can help you analyze a problem. They also collect information that is detailed enough to help a Microsoft Product Support engineer troubleshoot the problem. AppVerifier manages the tests that can help you locate and identify problems in applications and system components, such as the print spooler, printer queues, and printer drivers.
To install the Debugging Tools for Windows, do the following:
- Download the Windows Driver Kit for Windows Server 2012 and run the wdksetup.exe installer.
- Install Debugging Tools and Application Verifier, rest of WDK is optional.
Installing and Configuring Application Verifier
For information about installing and using AppVerifier, see Testing Applications with AppVerifier(http://technet.microsoft.com/library/bb457063.aspx) and the WinHEC PowerPoint presentation Print Driver Development Tools and Print Verifier http://download.microsoft.com/download/5/E/6/5E66B27B-988B-4F50-AF3A-C2FF1E62180F/CON-T608_WH08.pptx)TBD
Windows Debuggers
The Windows debuggers let you see inside applications and drivers and collect more detailed information about the application.
Debugging Tools for Windows includes several source-level debuggers: Console Debugger (CDB), Microsoft NT Symbolic Debugger (NTSD), Windows Debugger (WinDbg), and Kernel Debugger (KD).
CDB and NTSD
CDB is a character-based console program that enables low-level analysis of the user-mode memory and program code in Windows applications. NTSD is a variation of CDB that is identical to CDB in every way except that NTSD spawns a new text window when it is started whereas CDB inherits the command window from which it was invoked. Both CDB and NTSD are console applications that can debug user-mode programs.
NTSD is available in Debugging Tools for Windows and can also be found in the system32 directory of Windows. Because the version of NTSD in system32 is more limited than the version in Debugging Tools for Windows, you should use only the version of NTSD or CDB that was installed by Debugging Tools for Windows. The version of NTSD in the system32 directory has the following limitations:
- It cannot be used for remote debugging through the debugger.
- It might not match the information found in this document.
WinDbg
WinDbg is a Windows-based debugging tool that can debug both user mode and kernel mode. WinDbg provides source-level debugging for the Windows kernel, kernel-mode drivers, system services, user-mode applications, and user-mode drivers. WinDbg could be used to debug the print subsystem, but the NTSD commands that are described in this document might not work the same way in WinDbg.
KD
KD is a character-based console program that enables in-depth analysis of kernel-mode activity on all NT-based operating systems. KD supports multiprocessor debugging and can be used to debug kernel-mode programs and drivers and to monitor the behavior of the operating system. This debugger is not necessary for debugging the print subsystem because the print subsystem components run in user mode.
Application Verifier
AppVerifier is a run-time verification and test tool that monitors programs for compatibility, stability, and security issues. If you suspect that the print subsystem has a problem, you can also use the Print Verifier feature of AppVerifier to examine the print subsystem in greater detail. The Print Verifier feature is described later in this document.
AppVerifier Configuration
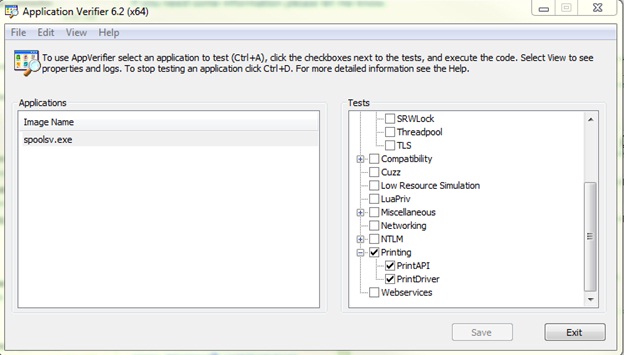
For Windows Server® 2003 SP1 and later versions of Windows, you can configure AppVerifier to help monitor and detect problems in the print spooler. Print Verifier is a feature of AppVerifier that provides additional monitoring of the print subsystem. By enabling the Print tests in AppVerifier, you can test how applications call the print APIs and detect problems in applications and printer drivers. Configure AppVerifier and the Print Verifier feature to monitor the print subsystem by entering the following command in a command window:
appverif -enable heaps exceptions locks handles PrintAPI PrintDriver -for spoolsv.exe printfilterpipelinesvc.exe printisolationhost.exe
After configuring the AppVerifier, you might be required to restart the computer for the settings to take effect. At the very least, you must restart the print spooler service.
Do Not: |
Only use the AppVerifier on the spooler process to troubleshoot a problem, do not enable these options if you are not troubleshooting a printer subsystem problem. Once the problem has been resolved, configure the AppVerifier to stop monitoring the Print Spooler process. |
The following screenshots show the spooler process correctly configured using the AppVerifier GUI:
Figure 1: AppVerifier Config 1

Figure 2 : AppVerifier Config 2
**
**
Spooler Configuration
The spooler includes additional debugging features that you can configure in the system registry. Use regedit.exe to make these changes manually, or use the regedit scripts that are found later in this document.
Warning: |
Use extreme caution when modifying the registry directly. Modifying some areas of the system registry can cause serious problems with the operating system. Make sure that you back up the registry and know how to restore it before you make any edits. |
The following section describes how to configure the spooler debugging features in Windows Server 2012.
In Windows Server 2012, the spooler supports the following debugging features:
Terminate on error
To explicitly control whether the system terminates the spooler when it encounters an error in the spooler, create a subkey named TerminateOnFatalException under the following registry key:
HKEY_LOCAL_MACHINE\SYSTEM\CurrentControlSet\Control\Print
Assign a REG_DWORD value to this subkey to enable (if nonzero) or disable (if zero) terminating on an error. By default (if the value is missing from the registry key or the registry key is missing), terminating on an error is enabled.
If this feature is disabled, the spooler's exception handler allows the exception to pass to the next available handler, which is Service Control Manager (SCM). The SCM writes a Service Stop Operations event (event ID 7037) to the Windows\System log.
Debug break on error
To enable the system to break into the debugger when it encounters an error in the spooler, create a subkey that is named BreakOnFatalException under the following registry key:
HKEY_LOCAL_MACHINE\SYSTEM\CurrentControlSet\Control\Print
Assign a REG_DWORD value to this subkey to enable (if nonzero) or disable (if 0) breaking on an error. By default (if the value is missing from the registry key or the registry key is missing), breaking on an error is disabled.
The TerminateOnFatalException and BreakOnFatalException keys affect error handling that occurs in the spooler, in the print filter pipeline, and in all printer driver isolation (“sandbox”) host processes. When one of these modules fails, the spooler reports the error to Windows Error Reporting (WER), which logs the error. A later section of this document describes how to view the log.
Print Spooler Vectored Exception Handler
The Print Spooler process contains an internal that is designed to handle the following exceptions:
Before Windows 7 :
EXCEPTION_ACCESS_VIOLATION
EXCEPTION_INT_DIVIDE_BY_ZERO
EXCEPTION_DATATYPE_MISALIGNMENT
Added in Windows 7 :
EXCEPTION_POSSIBLE_DEADLOCK
EXCEPTION_ILLEGAL_INSTRUCTION
EXCEPTION_BREAKPOINT
EXCEPTION_STACK_OVERFLOW
STATUS_INSTRUCTION_MISALIGNMENT
STATUS_PRIVILEGED_INSTRUCTION
STATUS_HANDLE_NOT_CLOSABLE
STATUS_ASSERTION_FAILURE
STATUS_GUARD_PAGE_VIOLATION
Regedit Script
Instead of manually creating the registry keys to configure the spooler for debugging, you can create a registry script to create the registry keys. Load the script into the registry by using regedit.exe. The following text is a registry script that can be saved as a text file and used to configure the spooler for debugging in Windows 7. To create this file, run Notepad and copy the following text into Notepad:
REGEDIT4
;;
;; Regedit script to enable Print Verifier debugging in
;; the print spooler in Windows Server 2012.
;;
[HKEY_LOCAL_MACHINE\SYSTEM\CurrentControlSet\Control\Print]
"TerminateOnFatalException"=dword:00000001
"BreakOnFatalException"=dword:00000001
The first line in the Notepad document must be the line that contains REGEDIT4. On the File menu, click Save As and, in the Save As dialog box, save the document by selecting All Files in the Save as type combo box and enter EnablePrintVer.reg in the File name box. The .reg file extension is required to associate this file with regedit.exe. In Windows Explorer, run EnablePrintVer.reg to add the values to the registry and configure the spooler for AppVerifier troubleshooting.
To remove these settings after you are finished troubleshooting the system, the following text can be saved as a text file and used by Regedit to clear the two registry entries. To create this file, run Notepad and copy the following text into Notepad:
REGEDIT4
;;
;; Regedit script to remove the Print Verifier debugging
;; settings for the print spooler in Windows Server 2012.
;;
[-HKEY_LOCAL_MACHINE\SYSTEM\CurrentControlSet\Control\Print
\TerminateOnFatalException]
[-HKEY_LOCAL_MACHINE\SYSTEM\CurrentControlSet\Control\Print
\BreakOnFatalException]
The first line in the Notepad document must be the line that contains REGEDIT4. On the File menu, click Save As and, in the Save As dialog box, save the document by selecting All Files in the Save as type combo box and enter DisablePrintVer.reg in the File name box. As with the previous file, the .reg file extension is required. In Windows Explorer, run DisablePrintVer.reg to remove the values from the registry and return the spooler to normal operation.
AppVerifier Output
If the spooler fails while AppVerifier is running, AppVerifier writes information about the failure to one or more log files. The following section discusses the log file that AppVerifier creates in Windows Server 2012.
When a spooler failure occurs in Windows Server 2012, AppVerifier always reports the failure to WER, which writes information about the failure to a log file that you can view through the Event Viewer system tool. To view the log file, do the following:
- From the Start Screen, search for Event Viewer and run it.
- In the left pane of the Event Viewer window, click Windows Logs, and then click Application.
After you complete these steps, a list of application events from the log file appears in the center pane of the Event Viewer window. Scroll through the list to find information about the spooler failure.
Running Tests and Analyzing Results
After you have configured the software, run the test or print the document that is causing the error or that tests the new configuration. When AppVerifier detects an error, it breaks into the debugger and displays a stop code with a message that indicates the nature of the problem.
Print Verifier Messages
The Print Verifier tests many different aspects of the components in the print subsystem such as how those components are used by the spooler and applications and how they use system resources. Print Verifier tests both the print APIs that an application uses and the resources that printer drivers use.
The Help file in AppVerifier contains more detailed information about the Print Verifier messages.
Collecting Data from Print Verifier Stops
When AppVerifier breaks into the debugger, you should first determine why the program stopped and then use the debugger to create a dump file. The dump file records the state of the system and the application at the time of the error.
If you want to continue to investigate the problem further by using the debugger, you should create a log file and keep detailed notes of your investigation. The log file will serve as a convenient reference when you review your investigation and can also provide valuable information to the Microsoft Product Support engineers.
Determine the Reason for the Stop
Before debugging the program, you must first determine whether AppVerifier or another program caused the program to stop in the debugger. Check the following conditions to make sure that you are investigating a problem in the print subsystem that AppVerifier detected.
- Has the program stopped at a user-mode breakpoint?
When a program stops at a user-mode breakpoint in the debugger, the console screen should display the following command prompt:
0:000>
The actual numbers that precede the greater-than sign (>) might be different because they indicate the process thread ID that is being debugged.
If the command prompt looks something like:
0:kd>
then the break is from the kernel debugger and the problem is outside the scope of this document.
- Was AppVerifier configured to test for heap errors in Spoolsv.exe?
Make sure that AppVerifier has the Heaps test enabled under the Basics test category in the Tests window for the spoolsv.exe application.
- Were all other programs under test configured for heap errors?
Make sure that, at a minimum, the Heaps test is enabled under the Basics test category in the Tests window of AppVerifier for all applications that are being tested. For more thorough testing. you can also enable the Exceptions, Locks, Handles, PrintDriver, and PrintAPI tests. When you test XPSDrv printer drivers, include printfilterpipelinesvc.exe in the Applications list.
- Did the debugger contain an AppVerifier message?
AppVerifier writes information to the debugger console after it detects an error but before it stops the program in the debugger. If no AppVerifier information appears in the debugger, there is still a problem to investigate; it is not merely a problem that AppVerifier found.
The following example shows an AppVerifier stop. The content of this message is determined by the nature of the problem that AppVerifier detected. AppVerifier help contains more detailed information about the Verifier Stop codes:
===========================================================
VERIFIER STOP 0000060F: pid 0xA20: unexpected exception raised while probing memory
C0000005 : Exception code.
0013E868 : Exception record. Use .exr to display it.
0013E884 : Context record. Use .cxr to display it.
134AB000 : Memory address
This verifier stop is continuable.
After debugging it use 'go' to continue.
Break instruction exception - code 80000003 (first chance)
ntdll!DbgBreakPoint:
77eaf2bc cc int 3
Create a Dump File
The first step in the debugging session is to preserve the context of the system and the program at the time it broke into the debugger. A user minidump file contains the available memory address space and records this information so that another person can analyze the problem after the system has been restarted. The dump file lets the problem be researched further at a later time and on a different machine, if necessary.
Saving the dump file by using the .dump command and selecting a descriptive file name for the dump file. Using the /ma option in the dump command line creates a minidump that contains memory data, handle data, unloaded module information, basic memory information, and thread time information. The following example illustrates a dump command that creates an output file:
c:\03_24_2004_11h_am.DMP.
The file name in this example was chosen to indicate the date and time that the dump file was created:
0:001> .dump /ma c:\03_24_2004_11h_am.DMP
Creating c:\03_24_2004_11h_am.DMP - mini user dump
Dump successfully written
0:001>
This log file contains the minimum information that you need to collect for a Microsoft Product Support engineer to analyze the problem. In some cases, you might also want to add the /ba option to the dump command to save the symbols and the image files along with the dump file in a .cab file. This creates a larger and more complete file that contains all the information that is necessary to analyze the problem on a machine that does not have access to the symbols. The following example illustrates this option added to the command that was used in the previous example:
0:001> .dump /ma /ba c:\03_24_2004_11h_am.DMP
Creating c:\03_24_2004_11h_am.CAB - mini user dump
Dump successfully written
0:001>
Once the dump files have been generated, send them to Microsoft Product Support for analysis.
Troubleshooting Windows Server 2012 Printing Features
Troubleshooting Branch Office Direct Printing
Branch Office Direct Printing can only be enabled by an administrator and it must be configured on the Server print queue. There is no way to configure Branch Office Direct Printing from a client.
If BODP is enabled on a print queue, the following registry key will be set:
HKLM\System\CurrentControlSet\Control\Print\Printers\Printer>\PrinterDriverData
VALUE: EnableBranchOfficePrinting
TYPE: REG_DWORD
A value of 1 indicates enabled and if the value does not exist or is set to 0 then BODP is disabled.
The Print Management Console will show that BODP is enabled on a queue when accessing the properties of a Printer. If Disable Branch Office Direct Printing is displayed then BODP is ENABLED:
Figure 35: Branch Office Direct Printing Enabled
Additionally, as noted in the Architecture section above, Branch Office Direct Printing is disabled if any of the following conditions are true:
- The enhanced point and print driver is used on the print queue
- The driver in use does not support Client Side Rendering
- The port used on the server is not a Standard TCP/IP port or WSD Port
- An administrator has manually enabled Server Side Rendering on the queue by disabling Client Side Rendering
- The keep printed jobs setting is enabled on the queue
- Printer pooling is enabled on the given queue
For more information about Branch Office Direct Printing, see Branch Office Direct Printing technical details (http://technet.microsoft.com/library/jj134152).
Event Log Information
For information about Print events logged in the Event Log, an article will be posted in the TechNet Wiki in the near future.