Troubleshooting the Monitoring Store Configuration
The Windows Server AppFabric monitoring capability is a great extension to the service hosting capabilities of the Windows Server 2008 platform. It provides the ability to easily watch WF and WCF services hosted in WAS or IIS for both health monitoring and troubleshooting. But how do you diagnose errors in the set-up of the monitoring service itself?
A good place to start is the AppFabric monitoring configuration checklist , and from there…
AppFabric has two data stores: a monitoring store and a workflow persistence store. These stores are paired with two Windows services, an event collection service paired with the monitoring store and a workflow management service paired with the workflow persistence store.
This article looks at the event collection service and monitoring store. This service is responsible for capturing the WF and WCF events emitted by services hosted in IIS/WAS and storing them in the monitoring store. These events are used to populate the dashboard that is integrated into IIS Manager. To enable capture of events you can use the ‘Manage WF and WCF Services | Configure...’ option in the web application context menu of IIS Manager or the PowerShell commands Set-ASAppMonitoring and Start-ASAppMonitoring. For help on these commands call get-help, e.g. ‘get-help Set-ASAppMonitoring’, from a PowerShell command line.
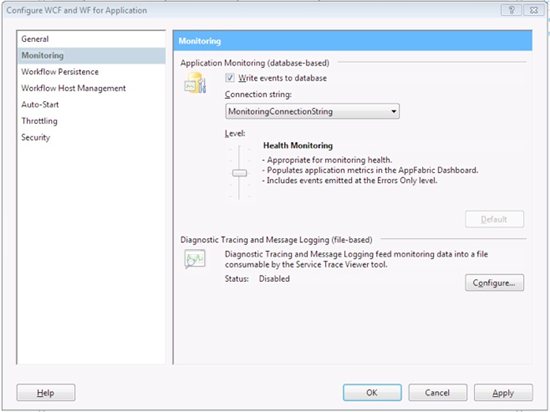
When you set up monitoring you need to provide a connection string name and set the monitoring level. As a minimum, the level needs to be set to Health Monitoring to populate the AppFabric dashboard. Below this are the levels Off and Errors Only which are self-explanatory. Above this level are End-to-End Monitoring and Troubleshooting both of which capture additional information. End-to-End Monitoring adds a header into WCF traffic to allow a logical call sequence to be followed. When a WCF service calls another WCF service the header flows across the call providing a correlation token with which to query.
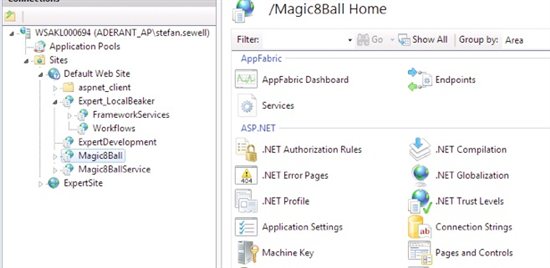
Note that the capture levels are cumulative; the higher level setting includes all of the events from the settings below. The higher the setting, the greater the impact on the performance of the system as more resources are required to capture and log the monitored events. For daily operations the Health Monitoring level is recommended. When troubleshooting is necessary, you can use the more verbose options. The connection string is a named connection string value, set as a property of the web application or on one of its ancestors. The connection string dashboard page is available from the ASP.NET section of the Features View for the web application.
Clicking on the Connection Strings option brings up the following:
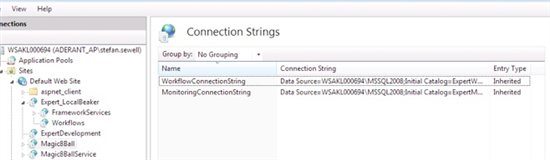
Note - The IIS configuration is hierarchical, the connection strings available to the Magic8Ball web application are both inherited. This means they are defined at a higher node in the tree. In this case the strings are defined in the machine web.config found at %SystemDrive%\Windows\Microsoft.NET\Framework64\v4.0.30319\Config. When installing AppFabric the default connection strings are written into the machine level web.config. Here both connection strings are set-up to use integrated security.
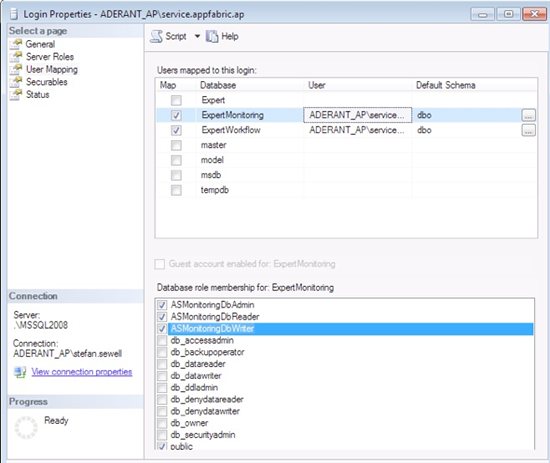
The AppFabric Event Collection Service is a Windows Service and is thus managed through the services administration snap-in, services.msc. To help set up integrated security from Windows to SQL Server, you can run the services under a domain account. Note that if you plan to use a machine that is not always on a domain, you need to use a local machine account.

This account needs to have login rights to the SQL Server and should be mapped to the ASMonitoringDbWriter role. In this case the user is mapped to all three roles set up in the monitoring store.
There are four Jobs managed by the SQL Agent that are used to populate and manage the tables in the monitoring database. These are:
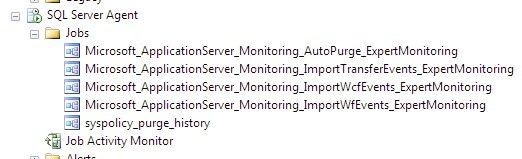
The SQL Server Agent service must be running for the tables to be populated. The Import*Events jobs run every 10 seconds by default. So if they are not correctly set up the application event log soon fills up with errors and warnings. These jobs call stored procedures defined in the monitoring database: ASImportTransferEvents, ASImportWcfEvents, ASImportWFEvents and run as the AS_MonitoringDbJobsAdmin. The AutoPurge job is scheduled to run once every minute and calls the ASAutoPurge stored procedure. These stored procedures in turn call ASInternal_* versions of themselves and you can drill into the SQL to see exactly what they do. To maintain the monitoring database you can use the Clear-ASMonitoringSqlDatabase command. Another option is to move the events to an archive database so that the queries feeding the dashboard remain responsive, see Set-ASMonitoringSqlDatabaseArchiveConfiguration. The archive database can then be managed as per any audit requirements you may have.
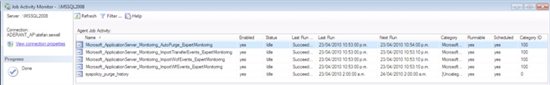
To monitor the SQL Agent jobs, you can use the Job Activity Monitor:
The Windows Event Viewer is a great help tracking down the cause of issues and AppFabric sets up a couple of custom logs.
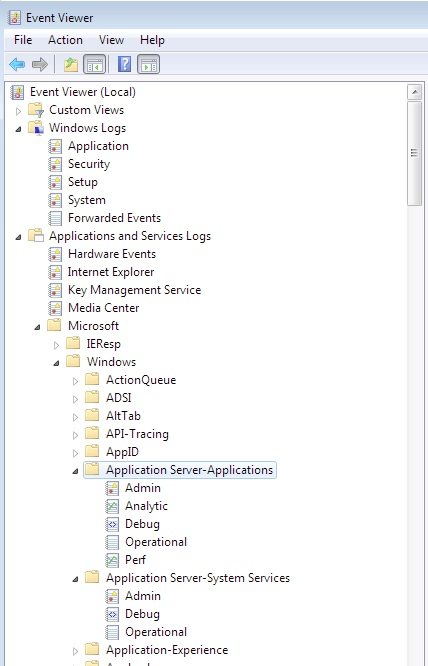
To see the Debug and Analytic logs you need to set the following:
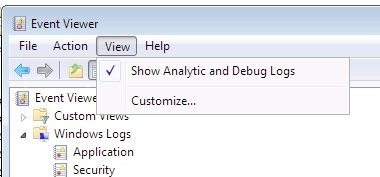
Right-click on a debug or analytic log and enable it. Make sure you disable it when you are finished to prevent performance degradation due to high volume event capture.
From these logs it is possible to determine that the IIS configuration has invalid entries, the SQL Server login is failing for the Event Collector and so on.