Debug Plug-in using Plugin Registration Tool
Debug Dynamics CRM 2011 Plug-ins using Plugin Registration Tool
This step-by-step will guide you to debug your plug-in assemblies using plugin registration tool.
In earlier versions of CRM, in order to debug any Plug-in or Custom workflow activity it was mandatory to copy the DLL and PDB files to “%Microsoft Dynamics CRM%\server\bin\assembly” directory and then attach the source code to server’s worker process i.e. w3wp.exe
Dynamics CRM 2011 provides a better mechanism by which developers can achieve the above with just few clicks and without accessing the CRM server.
Assumptions
This guide assumes following
- You have developed the plugin.
- Plugin assembly has been registered on CRM server.
- You have plugin registration tool handy and is connected to your CRM organization.
If you need any assistance on any of the above items then head to this link: http://msdn.microsoft.com/en-us/library/hh237515.aspx
Let's get started
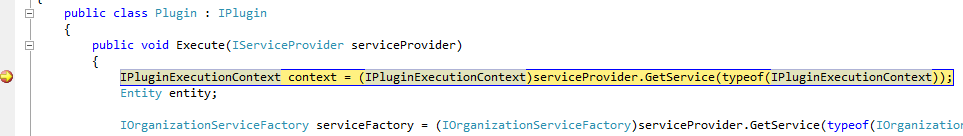
Build and register your Plugin as usual.

Inside Plugin Registration Tool, you’ll find a button which says Install Profiler, Click it.

Once it is done, you will find an entry for Plug-in Profiler beneath your assemblies.
Now, go-to the step for which you want to debug your plugin and press the Profile button.

Once done, you will see a tag (Profiled) adjacent to the step.

Now go ahead and execute the plugin i.e. perform the steps in CRM that will trigger this plugin.
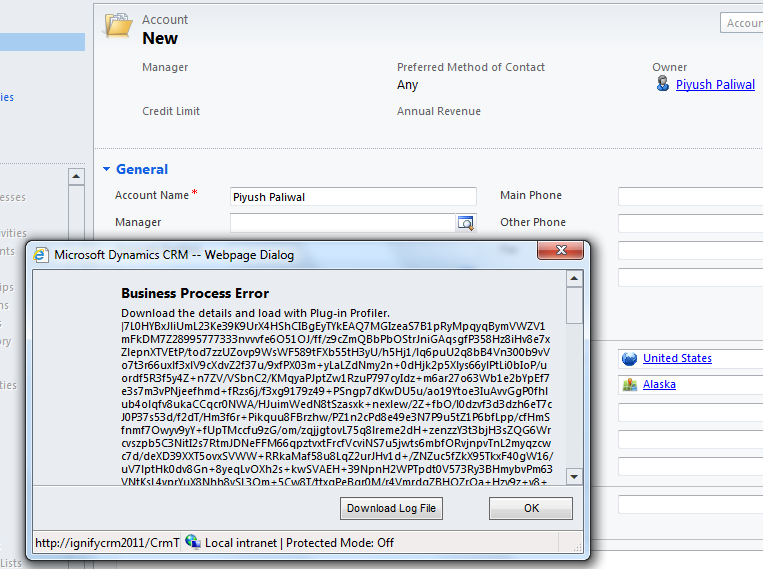
If the code has any errors, then CRM will provide you a log file to download; go ahead and download the file. (see screenshot below)
Now, inside Visual Studio, insert Breakpoints wherever you feel and use Attach to Process button and attach the code to Plugin Registration Tool exe.
Note: Initially you will see that VS cannot find symbols so breakpoints will not be hit.

Now, go back to Plugin Registration Tool and Select the Step which you profiled earlier hit Debug button.

A new Dialog-box will be presented to you, refer to the necessary files and hit Start Plug-in Execution button.

Wait for a few seconds and you will start to see the following in Plug-in Traces window from Debug screen.

Now, switch to Visual Studio and you will see that your first Breakpoint has been hit.
This article was originally posted on my personal blog at Dynamics CRM Parking Lot