Gaining Performance Insight into Windows Azure SQL Database
Understanding query performance in Windows Azure SQL Database can be accomplished by utilizing SQL Server Management Studio or the SET STATISTICS Transact-SQL commands. Since SQL Server Profiler isn’t currently supported with SQL Database, this article will discuss some alternatives the provide database administrators insight into exactly what Transact-SQL statements are being submitted to the server, and how the server accesses the database to return result sets.
Note
If you wish to contribute to this page, use the Edit tab at the top (sign-in required). If you wish to provide feedback for this documentation please either send e-mail to azuredocs@microsoft.com or use the Comment field at the bottom of this page (sign-in required).
SQL Server Management Studio
Utilizing SQL Server Management Studio you can view the Actual Execution Plan on a query. This gives insight into the indexes that SQL Database is using to query the data, the number of rows returned at each step, and which steps is taking the longest.
Here is how to get started:
Open SQL Server Management Studio 2008 R2; this version easily connects to SQL Database.
Open a New Query Window.
Copy/Paste Your Query into the New Query Window.
Click on the toolbar button to enable the Actual Execution Plan.
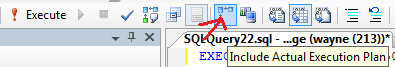
Or, choose Include Actual Execution Plan from the menu bar.

Once you have included your plan, run the query. This will give you another results tab that looks like this:


Reading an execution plan is the same in SQL Server 2008 R2 as it is in SQL Database, and how to read them is beyond the scope of this blog post, to find out more about Execution Plans, read: Reading the Graphical Execution Plan Output. One of the things I use execution plans for is to develop covered indexes to improve the performance of the query. For more information about covered index read this blog post.
USING “SET STATISTICS”
SET STATISTICS is a Transact SQL command you can run in the query window of SQL Server Management Studio to get back statistics about your queries execution. There are a couple variants on this command, one of which is SET STATISTICS TIME ON. The TIME command returns the parse, compile and execution times for your query.
Here is an example of the Transact SQL that turns on the statistic times:
SET STATISTICS TIME ON
SELECT *
FROM SalesLT.Customer
INNER JOIN SalesLT.SalesOrderHeader ON
SalesOrderHeader.CustomerId = Customer.CustomerId
I executed the example on the Adventure Works database loaded into SQL Database, and got these results:

SET STATISTICS will give you some “stop watch” metrics about your queries, as you optimized them you can rerun them with SET STATISTICS TIME ON to determine if they are getting faster.
Another flavor of SET STATISTICS is SET STATISTICS IO ON, this variant will give you information about the IO performance of the query in SQL Database. My example query looks like this:
SET STATISTICS IO ON
SELECT *
FROM SalesLT.Customer
INNER JOIN SalesLT.SalesOrderHeader ON
SalesOrderHeader.CustomerId = Customer.CustomerId
And the output looks like this:

We have covered I/O performance in SQL Database in an earlier this blog post, so I will not go into detail again here.
Observing running queries
With SQL Server you can utilize SQL Profiler to show all the queries running in real-time. In SQL Database, you can still get access to the running queries and their execution count, via the Procedure cache, with a Transact-SQL query similar to this:
SELECT q.text, s.execution_count
FROM sys.dm_exec_query_stats as s
cross apply sys.dm_exec_sql_text(plan_handle) AS q
ORDER BY s.execution_count DESC

For more information about how the procedure cache works in SQL Database, see this blog post.