FIM/MIM Synchronization: Troubleshooting Extensions
Note
This article is applicable to
- Microsoft Identity Integration Server (MIIS) 2003,
- Identity Lifecycle Manager 2007
- Forefront Identity Manager 2010
- MIM 2016
In the article the MIIS/ILM/FIM/MIMSync system is referenced as 'synchronization engine' (sync engine).
You need to keep in mind each of the products is linked to certain specific versions of the .NET Framework and Visual Studio.
Introduction
When troubleshooting your MA and MV extensions you'll need detail information on errors. Make sure you’re compiling them in debug mode.
Additionally, you can use logging and step-by-step (line-by-line) debugging, but these are not covered here.
Enable the advanced build configuration
Make sure you enable the advanced build configurations in Visual Studio.
To enable the advanced build configuration in Visual Studio
- Start Visual Studio
- Open the Options dialog, by clicking Tools from the Options menu.
- In the tree view, click General in the Projects and Solutions node.
- Select ‘Show advanced build configuration’.
The following screenshot shows an example for this:

When you enable the advanced build configurations, you have some interesting tools available, for example:
- Full debug information provides detailed error information when errors occur at run-time
- Breakpoints
I’ll discuss these options in the next section. Full debug information provides detailed error information when errors occur at run-time. To see full debug configuration information, you also need to compile the solution in debug mode.
To review the debug information:
- In Visual studio
- Set the extension compilation to debug mode
- Set the debug information generation to full
- Save and recompile the solution
- In the sync engine GUI
- Click the extension errors in the management run profile details or run history.
Compiling your VS extension in debug mode
To compile your solution in debug mode, open your extension in VS.NET, and check the solution properties. (Right click the solution in the VS Solution Explorer, select Properties).
Check the ‘Compile’ tab, option ‘Configuration’, as shown by the screenshot below.
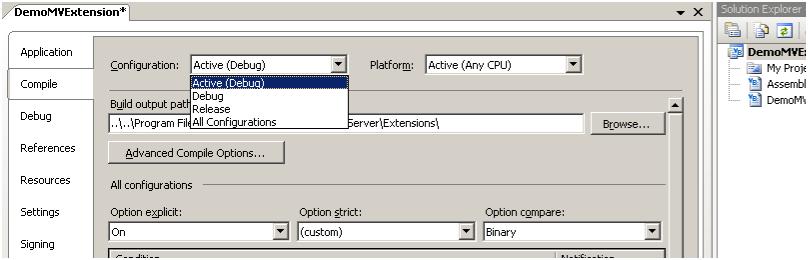
Debug mode and Release mode are different configurations for building your solution.
The Release mode optimizes the binary it produces (but optimizations can greatly complicate debugging), and generates no additional data to aid debugging.
As the name implies, you generally use the Debug mode for debugging your project, and the Release mode for the final build for the sync engine.
The debug mode disables optimizations and generates extra debug data.
When you run a program in Debug mode, Visual Studio enables you to use breakpoints to pause the program to examine the state of variables and objects.
Enable generation of full debug information
It’s not enough to enable the debug mode, you also need to enable the generation of full debug information.
In that way, the error messages contain more details.
And the more details you get, the better you can troubleshoot the extension.
In the screenshots below, we show you how to do so.
In the solution properties screen, select the ‘Advanced Compile options…’ button:

The following screenshot shows the options Visual Studio displays:
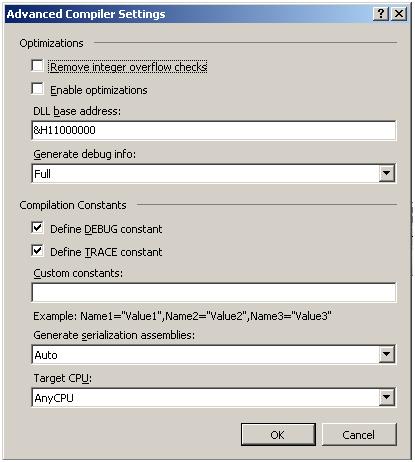
Make sure the ‘Generate debug info’ option is set to ‘Full’.
Save the extension and recompile it.
Let us take a look at the difference between the debug and release mode.
In the following example, we’ve created a small ILM/FIMSync setup (source AD, target ADAM).
Next, we enabled provisioning in ILM and activated an empty template MV extension as created by default by ILM.
After enabling the MV extension, we ran an import and a synchronization cycle.
At the end of this step, we got an “extension-entry-point-not-implemented” error. The following screenshots show an example for this.

You can get more details about the error by clicking the link of the error message.
The following screenshot shows the dialog that opens in this case.
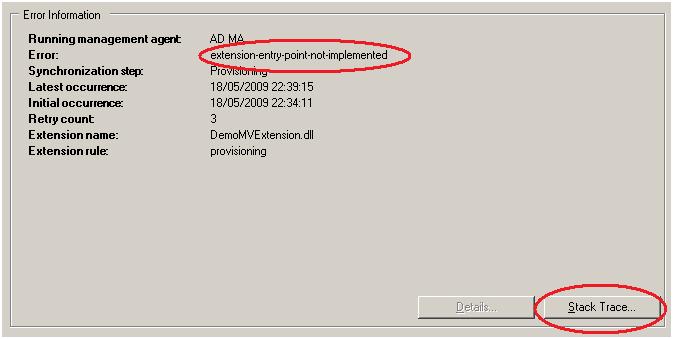
You can get to the root cause of an issue by clicking the Stack Trace button.
Clicking this button, opens a dialog that contains the exact exception information including the line number where the error occurred in your code.
The following screenshot shows an example for this.
If you click the ‘Stack Trace…’ button, ILM/FIM shows the screen below:

The Call Stack Information in the previous screenshot refers to line 20 in the extension source code.
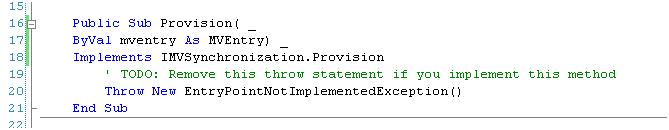
As you can see, the code always throws an error because of the ‘Throw New …’ statement.
Now, let’s disable the debug information generation:
- In Visual Studio
- Set the extension compilation to release mode
- Set the debug information generation to none
- Save and recompile the solution
- In the sync engine GUI
- Click the extension errors in the management run profile details or run history.
The following screenshot shows an example for this.
Set the ‘Generate debug info’ to ‘None’.

After saving the new settings, you need to recompile the extension.
When you run another synchronization run, you will not find detailed information about the error anymore.
The following screenshot shows an example of this.

With the debug configuration disabled, the call stack information is very limited. The sync engine does not tell you why, when and where the error occurs.
Note
Additionally, this is the exact information you need to provide to Microsoft Product Support Services, in case you need official support.
See Also
- Troubleshooting FIM 2010 Roadmap (TechNet Library)
- Current Forefront Identity Manager Resources
- Current Identity Lifecycle Manager Resources
Note
To provide feedback about this article, create a post on the FIM TechNet Forum.