SSRS: How to Calculate Total of Dynamic Columns
This article provides information about calculating total of dynamic columns (including only visible columns and excluding hidden columns) in SSRS table report.
Consider, for example, we have a table with 12 months of column data as shown below:
IF  EXISTS  (SELECT * FROM Sys.tables WHERE name  = 'SalesByMonths')
BEGIN
DROP TABLE   SalesByMonths
END

CREATE TABLE  SalesByMonths
    (Jan INT  ,Feb INT  ,Mar INT  ,Apr INT  ,
    May INT  ,Jun INT  ,Jul INT  ,Aug INT  ,
    Sep INT  ,Oct INT  ,Nov INT  ,Dec  INT )
GO

INSERT SalesByMonths
SELECT 100,200,300,400,500,600,
       700,800,900,1000,0,0
GO

SELECT * FROM SalesByMonths
GO

We are required to create a table report with two latest months (including current month) and total of months displayed: (as shown below)
** Sep**
** Oct**
** Total**
900
1000
1900
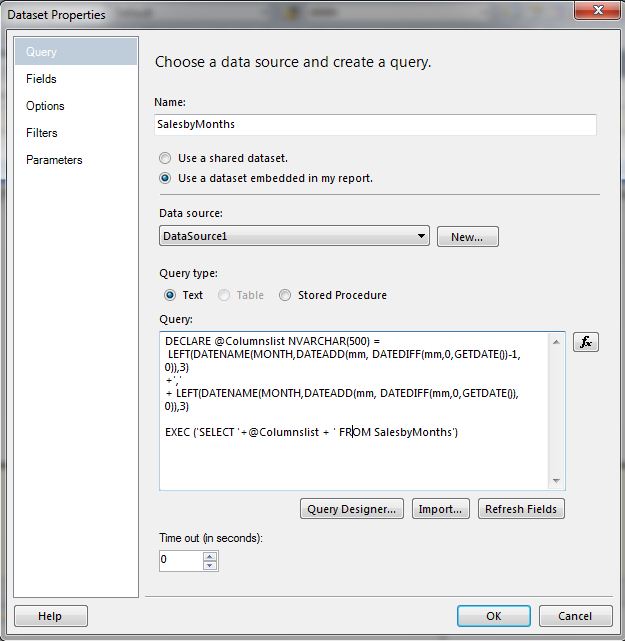
Below code block is a dataset query: (which brings only latest two months column using dynamic SQL)
DECLARE @Columnslist NVARCHAR(500) =
 LEFT(DATENAME(MONTH,DATEADD(mm, DATEDIFF(mm,0,GETDATE())-1, 0)),3)
+','
+ LEFT(DATENAME(MONTH,DATEADD(mm, DATEDIFF(mm,0,GETDATE()), 0)),3)

EXECUTE ('SELECT '+ @Columnslist + ' FROM SalesByMonths')
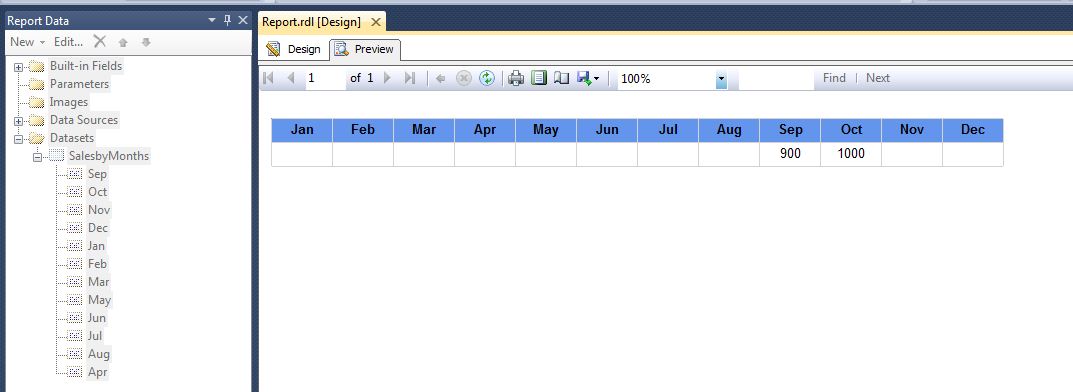
If you expand the dataset, under Report Data (CTRL + ALT + D) - > Datasets - > SalesbyMonths, you will find only two fields (Sep, Oct)
because dataset query returns only two latest month columns.
We have to add other month columns manually under Dataset Properties - > Fields - > Add - > Query Field , as shown below:

Drag & drop Table from Report Items - > on to the report body - > and then assign columns from dataset to the table. If we click Preview pane the report will look as shown below:
Go back to Design pane. Add extra column on to the table report "Total" and add below expression for "Total" column:
=Fields!Jan.Value +  Fields!Feb.Value + Fields!Mar.Value + Fields!Apr.Value
+ Fields!May.Value + Fields!Jun.Value + Fields!Jul.Value + Fields!Aug.Value
+ Fields!Sep.Value + Fields!Oct.Value + Fields!Nov.Value + Fields!Dec.Value
If we click Preview pane, the report will look like as shown below:

The error in the Total column is because the expression contains all month columns, and except for Sep & Oct, other columns are missing (manually added not actually returned from Dataset).
We will see about two ways for calculating total of dynamic columns (including only visible columns and excluding hidden columns) in the later part of this article.
We are always required to hide the columns on the report which do not hold any data, we can handle this by setting Column Visibility property.
To set Column Visibility property - > Right-click on report column - > Column Visibility... -> show or hide based on expression:
=IIF(Fields!Jan.IsMissing,True,False)
In a similar way, add for remaining eleven months column on the report.
After setting Column Visibility property and removing expression for Total column, If we click Preview pane, the report will look like as shown below:

Calculate Total of Dynamic Columns
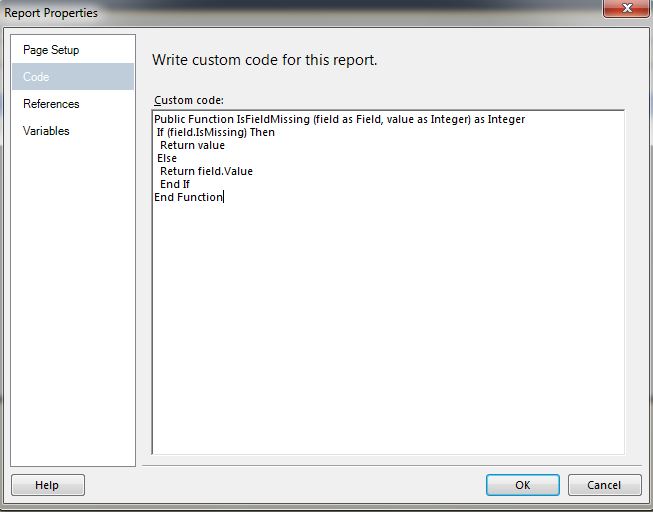
Approach 1: Handling missing columns using custom code
Click outside the body of the report - > right-click - > Report Properties - > Code - > add this Custom code:
Public Function  IsFieldMissing (field as Field, value as Integer) as Integer
 If (field.IsMissing) Then
  Return value
 Else
  Return field.Value
  End If
End Function
Now add expression for Total column as shown in this code block:
=Code.IsFieldMissing (Fields!Jan,0) + Code.IsFieldMissing (Fields!Feb,0) +
Code.IsFieldMissing (Fields!Mar,0) + Code.IsFieldMissing (Fields!Apr,0) +
Code.IsFieldMissing (Fields!May,0) +Code.IsFieldMissing (Fields!Jun,0) +
Code.IsFieldMissing (Fields!Jul,0) + Code.IsFieldMissing (Fields!Aug,0) +
Code.IsFieldMissing (Fields!Sep,0) + Code.IsFieldMissing (Fields!Oct,0) +
Code.IsFieldMissing (Fields!Nov,0) + Code.IsFieldMissing (Fields!Dec,0)
If we click the Preview pane, the report will look like as expected (as shown below):

Approach 2: Calculating total using dynamic SQL
Replace the DataSet query using below code block:
DECLARE @Columnslist NVARCHAR(500) =
 LEFT(DATENAME(MONTH,DATEADD(mm, DATEDIFF(mm,0,GETDATE())-1, 0)),3)
+','
+ LEFT(DATENAME(MONTH,DATEADD(mm, DATEDIFF(mm,0,GETDATE()), 0)),3)

DECLARE @Total NVARCHAR(50) = REPLACE(@Columnslist,',','+')

EXEC ('SELECT '+@Columnslist + ','+ @Total +' Total FROM SalesbyMonths')
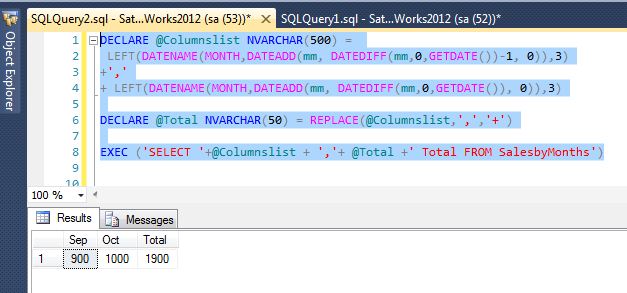
Instead of writing expression for Total column, assign value for the Total column from the DataSet. If we click the Preview pane, the report will look as expected (as shown below):

Reference:
http://technet.microsoft.com/en-us/library/dd283100.aspx
Additional Resources
- SSRS - IsMissing - Visibility Function
- SSRS - How to add Custom Code and example for using Custom Code
See Also
- SSRS: How to set Column Visibility Property for Many Columns Based on Parameter's Value
- SQL Server Reporting Services Portal
- My SSRS Articles