Easily Debug or Optimize LINQ Queries using LINQPad
Introduction
The best way to focus on a particular "problem" area is often to look at it sandboxed, so that you can focus on the problem or issue at hand. I recently had to optimize a LINQ query, which was quite complicated & debugging / optimizing from within Visual Studio proved quite difficult & time consuming as well!
LINQPad to the Rescue!
Thanks to an architect in our team, who suggested LINQPad. By using LINQPad, we can focus on a particular LINQ query, make adjustments & quickly see results as well (which are timed too!).
Debugging LINQ Queries
You can easily try out your queries using LINQPad:

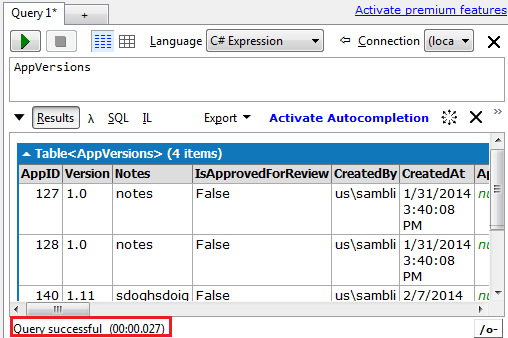
Tracking Query Performance
Query timings are also displayed below the results (very useful info when trying to optimize queries):
Conclusion
We can easily debug or optimize our LINQ queries by using tools such as LINQPad, instead of doing the same from within Visual Studio (which is possible but very time consuming, especially if your solution has multiple projects, each being very complex - as it the case in any enterprise application)
You can download & install LINQPad from here.